Yoma Strategic: Doji at 20D SMA Resistance

  • Post author:

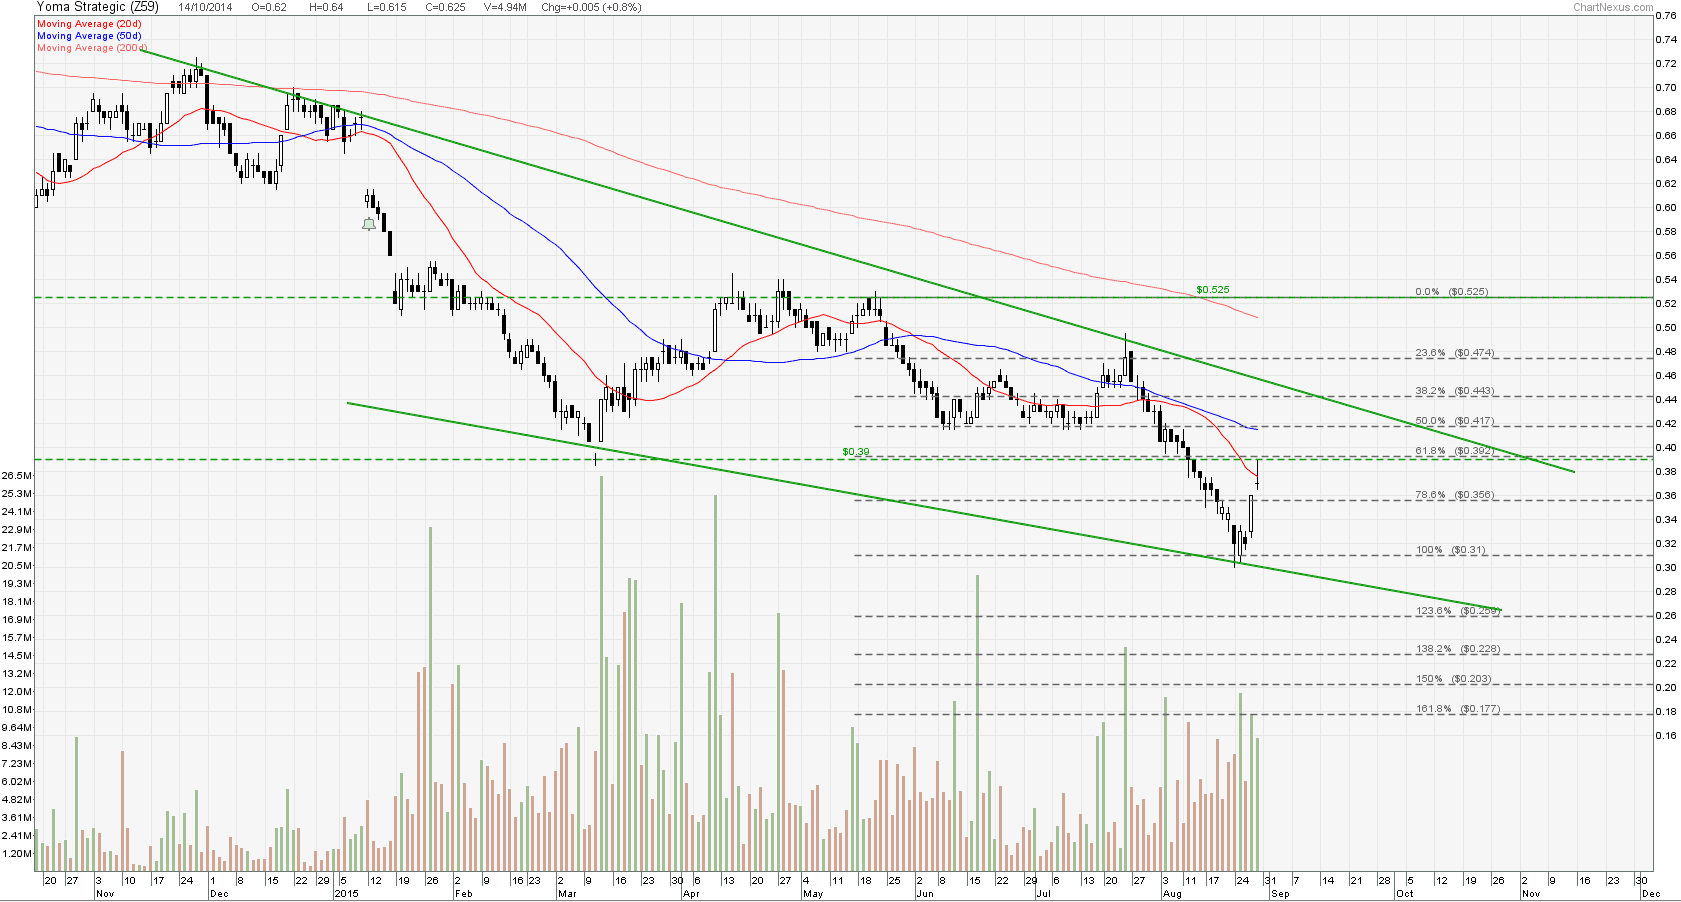
Yoma Strategic showed a Doji at 20D SMA Resistance. Wait for next candlestick pattern to short.

Yoma Strategic Aug 29-2015

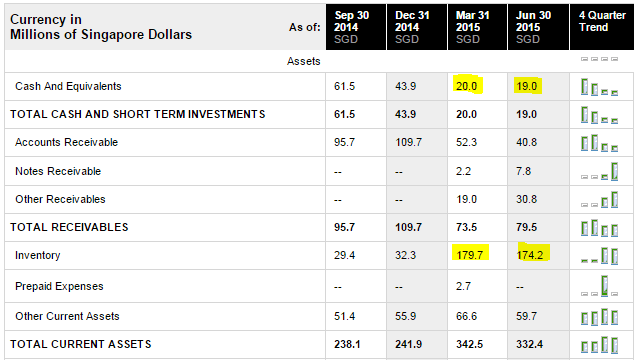
Fundamentally Yoma Strategic may have cash flow problems in future as the company has built up inventory which may not be able to clear in future.

Yoma Strategic BalanceSheet Aug 29-2015

  • Last Done Price = $0.37
  • PE Ratio =18.59
  • PB Ratio = 1.01
  • Gross Margin (TTM) = 43.51
  • Net Margin (TTM) = 33.46
  • ROA  (TTM) = 5.9
  • ROE (TTM) = 5.77
  • Current Ratio (MRQ) = 3.91
  • Quick Ratio (MRQ) = 1.86
  • ** Check Net Operation Cash Flow carefully. Gross Margin and Net Margin looks good but Operation Cash Flow is telling another story.

Source: Reuters

Continue ReadingYoma Strategic: Doji at 20D SMA Resistance

Mapletree Commercial Trust Fundamental and Technical Analysis

  • Post author:

Mapletree Commercial Trust (MCT) Fundamental Analysis base on Investor Meeting on July 23-2015.

Mapletree Comm Occupancy Aug26-2015 Mapletree Comm WADM Aug26-2015 Mapletree Comm WALE Aug26-2015Mapletree Comm Structure Aug26-2015

Technically Mapletree Commercial Trust is trading on down trend after dropping 23% from the peak. There is no sign of bottoming up yet.Mapletreecom REIT Aug26-2015


See other Singapore REIT Fundamental Analysis Comparison here.


Continue ReadingMapletree Commercial Trust Fundamental and Technical Analysis

FIRST REIT: Watch the 200D SMA Support

  • Post author:

First REIT is one of the very few REITs in Singapore still trading above 200D SMA support. Can First REIT escape the current REIT sector sell off? Watch the 200D SMA support closely. By the way, this Healthcare REIT has formed a  “Lower Low, Lower High” down trend channel pattern.

2015Aug17-FirstREIT

See previous post on FIRST REIT here.

Singapore REIT Fundamental Analysis Comparison Table.

Continue ReadingFIRST REIT: Watch the 200D SMA Support