
Yoma Strategic showed a Doji at 20D SMA Resistance. Wait for next candlestick pattern to short.
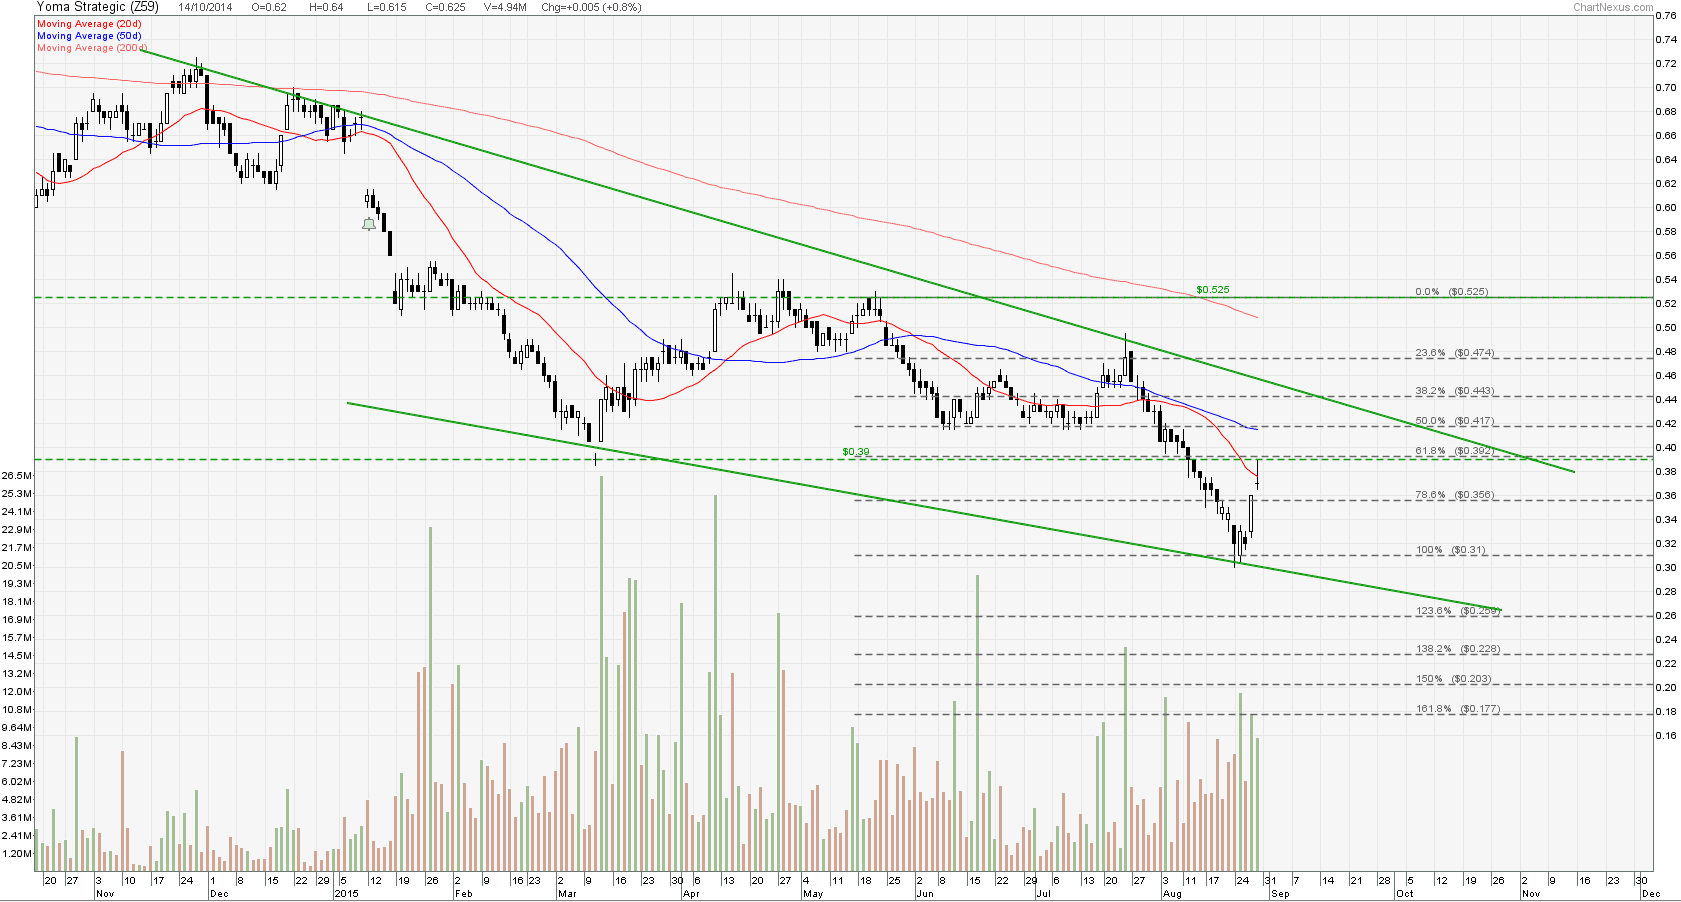
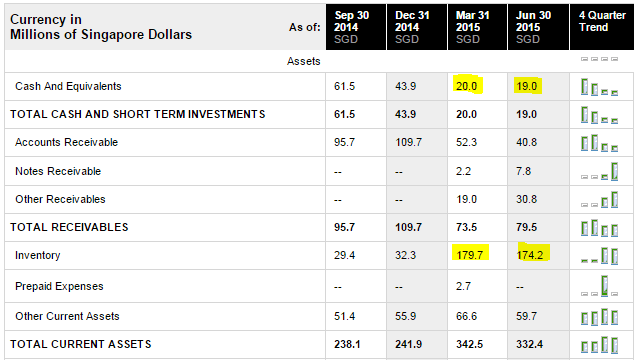
Fundamentally Yoma Strategic may have cash flow problems in future as the company has built up inventory which may not be able to clear in future.
- Last Done Price = $0.37
- PE Ratio =18.59
- PB Ratio = 1.01
- Gross Margin (TTM) = 43.51
- Net Margin (TTM) = 33.46
- ROA (TTM) = 5.9
- ROE (TTM) = 5.77
- Current Ratio (MRQ) = 3.91
- Quick Ratio (MRQ) = 1.86
- ** Check Net Operation Cash Flow carefully. Gross Margin and Net Margin looks good but Operation Cash Flow is telling another story.
Source: Reuters