KepCorp: Rejected at 200D SMA Resistance

  • Post author:

KepCorp share price is rejected at 200D SMA Resistance after breaking out from the Double Bottoms. Is this only a Dead Cat Bounce before continuing the down trend for Kep Corp? Keep a close eye on the support zone between $8.90 and $9.00.

2015April17-KepCorp-800x600

Original post by Marubozu My Stocks Investing Journey.

Current P/E Ratio (ttm) 8.8179
Estimated P/E(12/2015) 10.3700
Relative P/E vs. FSSTI 0.6222
Earnings Per Share (SGD) (ttm) 1.0490
Est. EPS (SGD) (12/2015) 0.8920
Est. PEG Ratio 10.8814
Market Cap (M SGD) 16,760.64
Shares Outstanding (M) 1,811.96
30 Day Average Volume 4,629,987
Price/Book (mrq) 1.5486
Price/Sale (ttm) 1.2816
Dividend Indicated Gross Yield 5.19%
Cash Dividend (SGD) 0.3600
Dividend Ex-Date 04/22/2015
5 Year Dividend Growth 5.12%
Next Earnings Announcement 07/24/2015

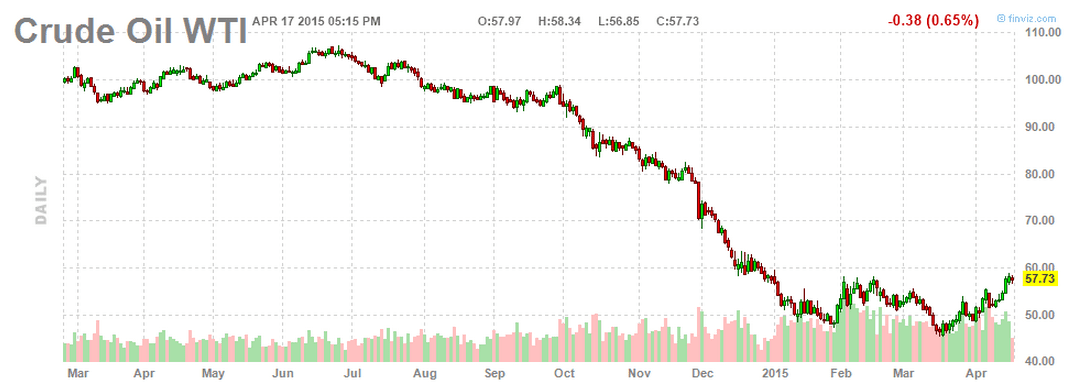
Another thing to watch is the Crude Oil stock chart. Crude Oil is currently showing a Double Bottom, a trend reversal chart pattern, but testing the neckline resistance.

Crude Oil April17-2015

Continue ReadingKepCorp: Rejected at 200D SMA Resistance

City Development: Start of a New Up Trend?

  • Post author:

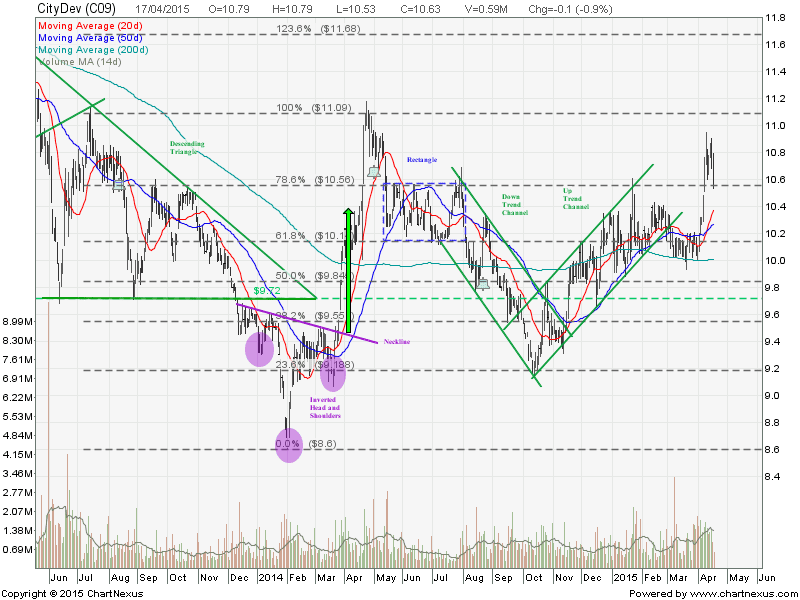
Is City Development starting a new uptrend after rebounded from the 200D SMA support? Base on 20D and 50D SMA direction, it looks like City Development is starting a new bull round. Need to see whether $10.55 resistance turned support level can be hold to confirm the uptrend. This level is also the 61.8% Fibonacci Retracement Level if using $10.00 as 0% FR and $10.90 as 100% FR. Immediate resistance at $10.90 followed by $11.09.

2015April17-CITYDEV-800x600

There are many interesting chart patterns in City Development like Descending Triangle, Inverted Head and Shoulders, Rectangle, Channels, which can increase the winning probability. Want to learn how to increase your winning probability trades by using the reliable chart patterns? Check out  High Winning Probability Trading with Chart Patterns course here.

Current P/E Ratio (ttm) 12.7611
Estimated P/E(12/2015) 15.4506
Relative P/E vs. FSSTI 0.9005
Earnings Per Share (SGD) (ttm) 0.8330
Est. EPS (SGD) (12/2015) 0.6880
Est. PEG Ratio 1.5474
Market Cap (M SGD) 9,666.79
Shares Outstanding (M) 909.39
30 Day Average Volume 1,198,430
Price/Book (mrq) 1.1963
Price/Sale (ttm) 2.5680
Dividend Indicated Gross Yield 0.75%
Cash Dividend (SGD) 0.0400
Dividend Ex-Date 04/30/2015
5 Year Dividend Growth 9.86%
Next Earnings Announcement 05/14/2015
Continue ReadingCity Development: Start of a New Up Trend?

SembCorp Industry: Watch out for Pull Back

  • Post author:

SembCorp has been a solid bull run for the past 2 weeks after breakout from a Rectangle with increase of volume. Watch out for pull back as SembCorp is overbought and reaching the 200D SMA resistance & previous support turned resistance at about $4.75. A Shooting Star candlestick was formed at the resistance also. $4.5 is a good entry level for bullish trade if this support holds. Take note on the Dividend XD Date on April 23 and Quarterly earning announcement on May 7.

2015April16-SembCorp-800x600

Original post by Marubozu My Stocks Investing Journey.

Current P/E Ratio (ttm) 10.7876
Estimated P/E(12/2015) 10.6935
Relative P/E vs. FSSTI 0.7580
Earnings Per Share (SGD) (ttm) 0.4431
Est. EPS (SGD) (12/2015) 0.4470
Est. PEG Ratio
Market Cap (M SGD) 8,527.28
Shares Outstanding (M) 1,783.95
30 Day Average Volume 3,006,113
Price/Book (mrq) 1.5754
Price/Sale (ttm) 0.7837
Dividend Indicated Gross Yield 4.60%
Cash Dividend (SGD) 0.1100
Dividend Ex-Date 04/23/2015
5 Year Dividend Growth 14.87%
Next Earnings Announcement 05/07/2015
Continue ReadingSembCorp Industry: Watch out for Pull Back