
Is City Development starting a new uptrend after rebounded from the 200D SMA support? Base on 20D and 50D SMA direction, it looks like City Development is starting a new bull round. Need to see whether $10.55 resistance turned support level can be hold to confirm the uptrend. This level is also the 61.8% Fibonacci Retracement Level if using $10.00 as 0% FR and $10.90 as 100% FR. Immediate resistance at $10.90 followed by $11.09.
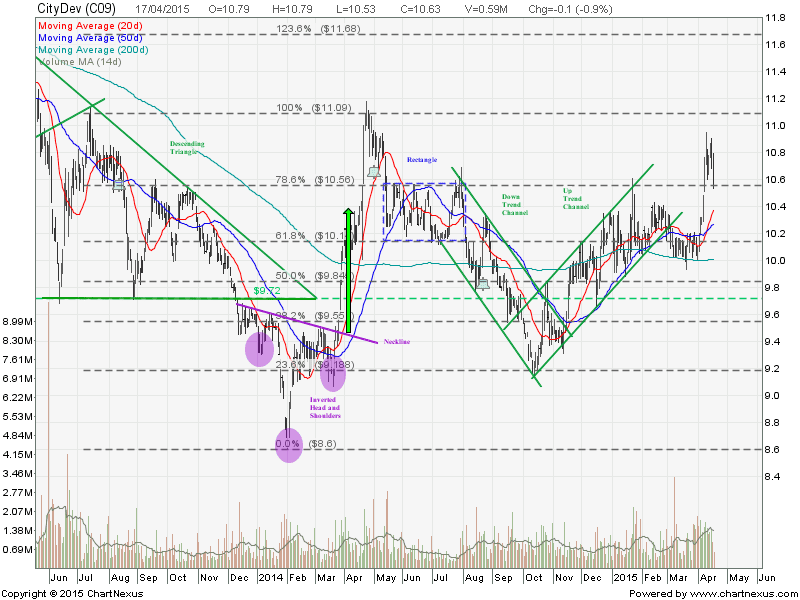
There are many interesting chart patterns in City Development like Descending Triangle, Inverted Head and Shoulders, Rectangle, Channels, which can increase the winning probability. Want to learn how to increase your winning probability trades by using the reliable chart patterns? Check out High Winning Probability Trading with Chart Patterns course here.
| Current P/E Ratio (ttm) | 12.7611 |
|---|---|
| Estimated P/E(12/2015) | 15.4506 |
| Relative P/E vs. FSSTI | 0.9005 |
| Earnings Per Share (SGD) (ttm) | 0.8330 |
| Est. EPS (SGD) (12/2015) | 0.6880 |
| Est. PEG Ratio | 1.5474 |
| Market Cap (M SGD) | 9,666.79 |
| Shares Outstanding (M) | 909.39 |
| 30 Day Average Volume | 1,198,430 |
| Price/Book (mrq) | 1.1963 |
| Price/Sale (ttm) | 2.5680 |
| Dividend Indicated Gross Yield | 0.75% |
| Cash Dividend (SGD) | 0.0400 |
| Dividend Ex-Date | 04/30/2015 |
| 5 Year Dividend Growth | 9.86% |
| Next Earnings Announcement | 05/14/2015 |