Capita Commercial Trust on Up Trend: Time to Buy More?

  • Post author:

Technically Capita Commercial current stock price still on up trend but close to all time high.

Fundamentally (base on valuation and distribution yield) & Technically upside potential is very limite for Capita Commercial Trust.

2015Feb13-CapitaComm-800x600

Continue ReadingCapita Commercial Trust on Up Trend: Time to Buy More?

Noble Group: Down Trend Ended?

  • Post author:

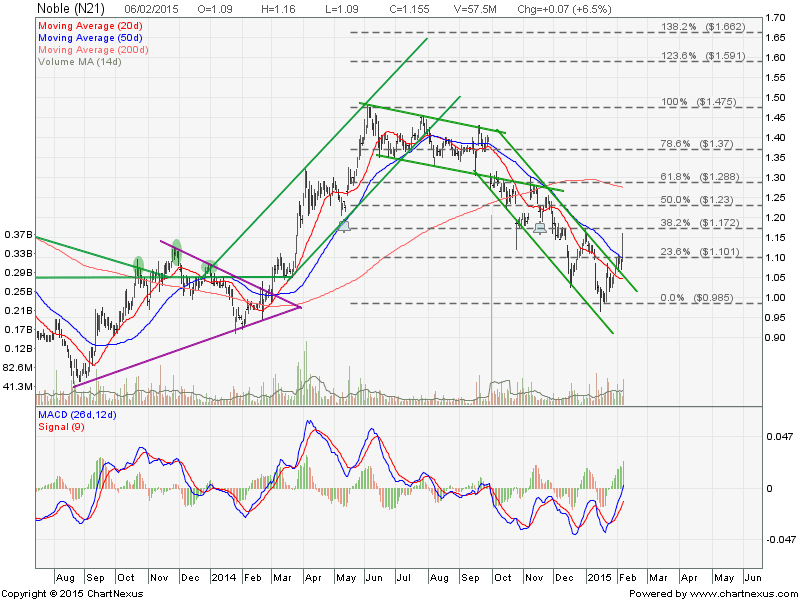
Noble Group has broken out from the Down Trend Channel resistance. This is the 1st sign of potential reversal pattern. Things to watch for the reversal confirmation:

  • 20D & 50D starts to trend up.
  • A Higher High, Higher Low chart pattern formation.
  • Noble has to clear $1.17 resistance (38.2% Fibonacci Retracement Level)
  • Potential formation of Inverted Head and Shoulders with neckline at $1.17.

Potential Entry Point (Long position):

  • Noble pull back to form the Right Shoulder (Inverted Head and Shoulders)
  • Breakout at $1.17 and turned this resistance to support level.

Original post by Marubozu from My Stocks Investing Journey.

2015Feb6-Noble Group

Current P/E Ratio (ttm) 9.8036
Estimated P/E(12/2014) 11.6948
Relative P/E vs. FSSTI 0.6525
Earnings Per Share (USD) (ttm) 0.0871
Est. EPS (USD) (12/2014) 0.0730
Est. PEG Ratio 0.1893
Market Cap (M SGD) 7,784.08
Shares Outstanding (M) 6,739.47
30 Day Average Volume 26,969,120
Price/Book (mrq) 1.1027
Price/Sale (ttm) 0.0605
Dividend Indicated Gross Yield 0.99%
Cash Dividend (USD) 0.0300
Dividend Ex-Date 11/18/2014
5 Year Dividend Growth 3.75%
Next Earnings Announcement 02/18/2015
Continue ReadingNoble Group: Down Trend Ended?

OCBC Bank: False Breakout?

  • Post author:

OCBC Bank has broken $10.50 resistance recently. This $10.50 resistance is also the Ascending Triangle resistance. If this is a real breakout, price target for OCBC Bank is about $11.10.  Take note that there is no spike in volume to support this breakout. Is this a successful breakout or a false breakout? We will only know the answer after the earning release on Feb 11.

Original post by Marubozu from My Stocks Investing Journey.

2015Feb6-OCBC Bk-800x600

Current P/E Ratio (ttm) 10.1169
Estimated P/E(12/2014) 11.1864
Relative P/E vs. FSSTI 0.6783
Earnings Per Share (SGD) (ttm) 1.0438
Est. EPS (SGD) (12/2014) 0.9440
Est. PEG Ratio 1.1150
Market Cap (M SGD) 42,065.89
Shares Outstanding (M) 3,983.51
30 Day Average Volume 4,300,717
Price/Book (mrq) 1.4624
Price/Sale (ttm) 3.5757
Dividend Indicated Gross Yield 3.22%
Cash Dividend (SGD) 0.1750
Dividend Ex-Date 08/25/2014
5 Year Dividend Growth 4.56%
Next Earnings Announcement 02/11/2015
Continue ReadingOCBC Bank: False Breakout?