Capita Commercial Trust: Under Watchlist
Fundamental Analysis of Capita Commercial Trust:
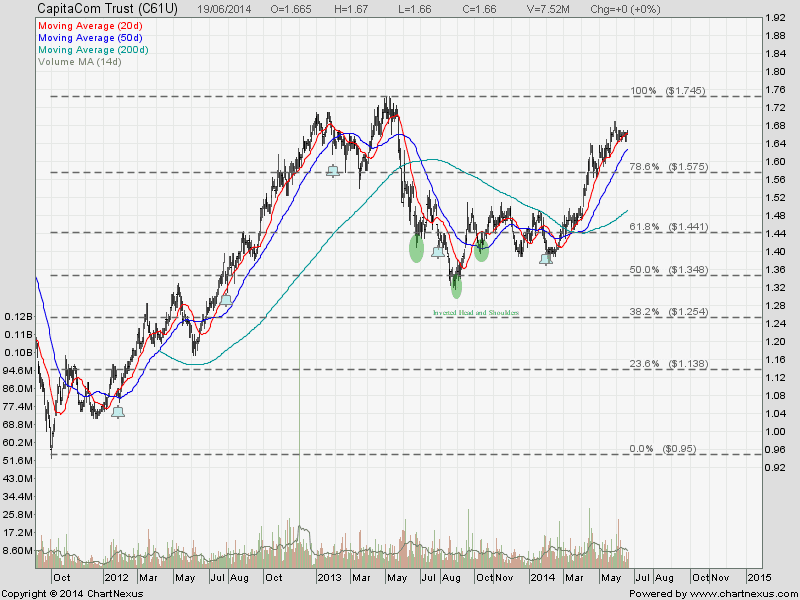
- Last Price = $1.665
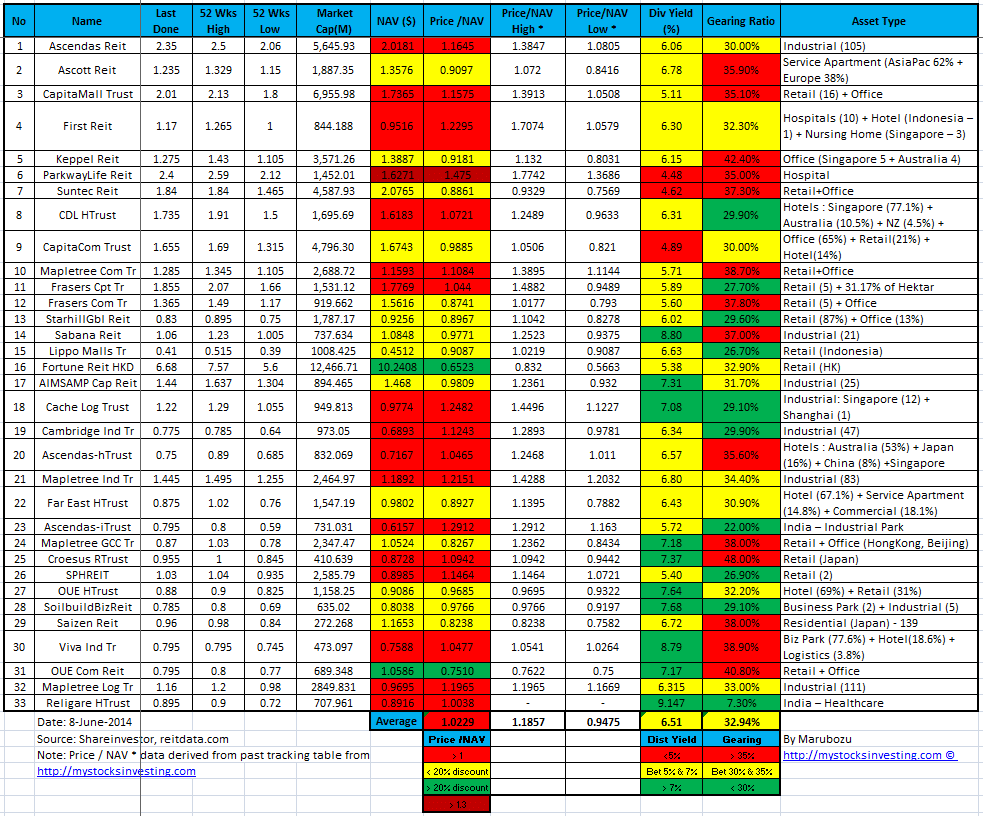
- NAV = $1.6743
- Price / NAV = 0.9986
- Price / NAV (52 Weeks High) = 1.0506
- Price / NAV (52 Weeks Low) = 0.8210
- Distribution Yield = 4.836%
- Gearing Ratio = 30%
- Occupancy Rate = 98.7%
- WADM = 3.7 Years
- WALE = 7.9 Years
- Base on Capita Commercial Trust April 14 Presentation.


.
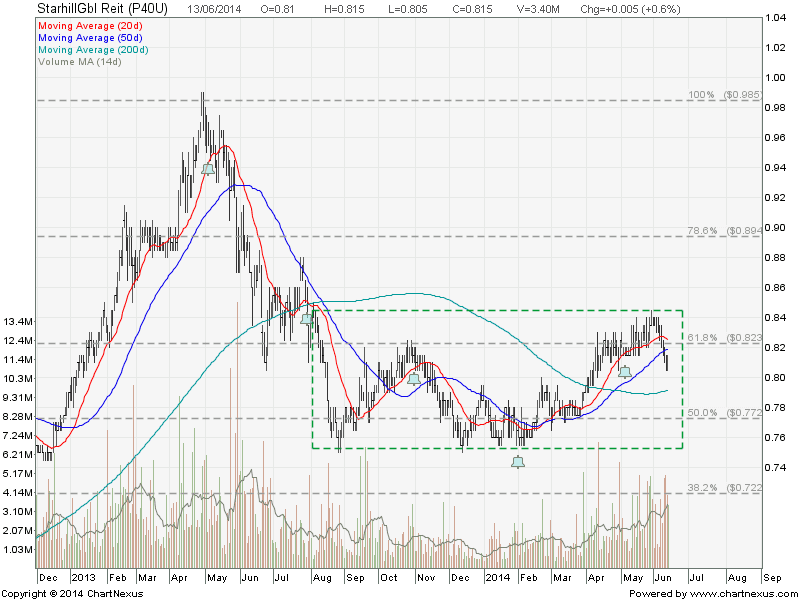
Technically Capita Commercial Trust is on the up trend. However, the stock price is getting near to the 3 years high of $1.745.
Compare with other Singapore REITs, Capita Commercial Trust is trading at its fair value with gearing of 30% and Price / NAV is getting near to the high side. Furthermore, the yield of 4.836% does not appear attractive to me as there are other REITs which can offer a better DPU yield. Combining both Fundamental & Technical Analysis, the current price for Capita Commercial Trust is not attractive to me at all. Keep in View.
I will be covering the above analysis method in my Singapore REIT Investing public workshop, I strongly suggest you to sign up and understand how to do a proper analysis (Fundamental Analysis, Risk Assessment, Technical Analysis) on the REIT before throwing the money into stock market by selecting the wrong REIT and investing in the wrong time. Investors should NEVER just look at the Distribution Yield for investment decision for REIT. High Yield REIT does NOT mean that it is a good REIT. Vice versa, low DPU Yield REIT does not mean that it is a bad investment. There is another aspect of Risk Assessment in order to have a well covered analysis.
.
.
.