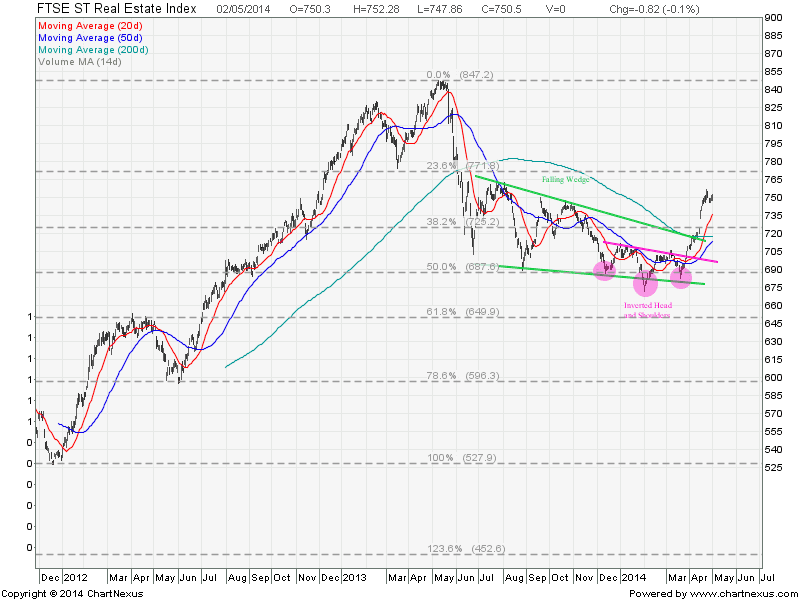
FTSE ST Real Estate Index Chart
FTSE ST Real Estate Index has started a trend reversal in April 2014 after breaking out from a Falling Wedge. The index is currently starting an uptrend. So this is a good time to start to pick up some fundamentally strong property stocks and REITs.
Last Analysis on Singapore Property Stocks and REITs here.
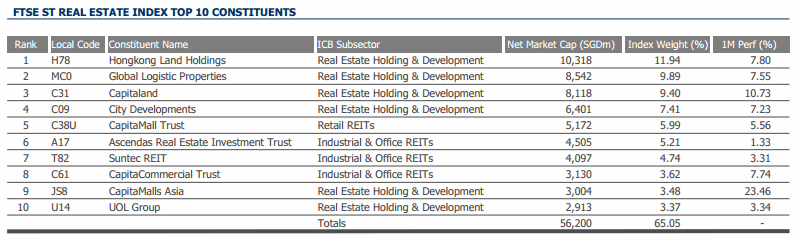
FTSE ST Real Estate Index Components Stocks (Total 50 Stocks)
All Top 10 Constituents posted positive gain in the month of April led by CapitaMalls Asia, CapitaCommercialTrust and Capitaland. Read the News here CapitaLand Offers S$3.06 Billion to Buy CapitaMalls Asia.
For Singapore REIT, Click here for Singapore REITs Fundamental analysis.
Fundamental Comparison for Key Component Stocks and Property Stocks
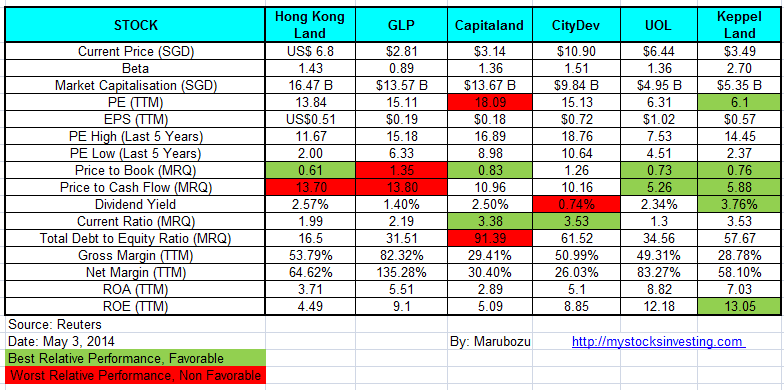
Check out how to use Fundamental Analysis to pick the right stocks, what is the meaning of PE Ratio, Current Ratio, ROA, ROE here. Price to Book Value remains attractive for Hong Kong Land, Capitaland, UOL and Keppel Land.
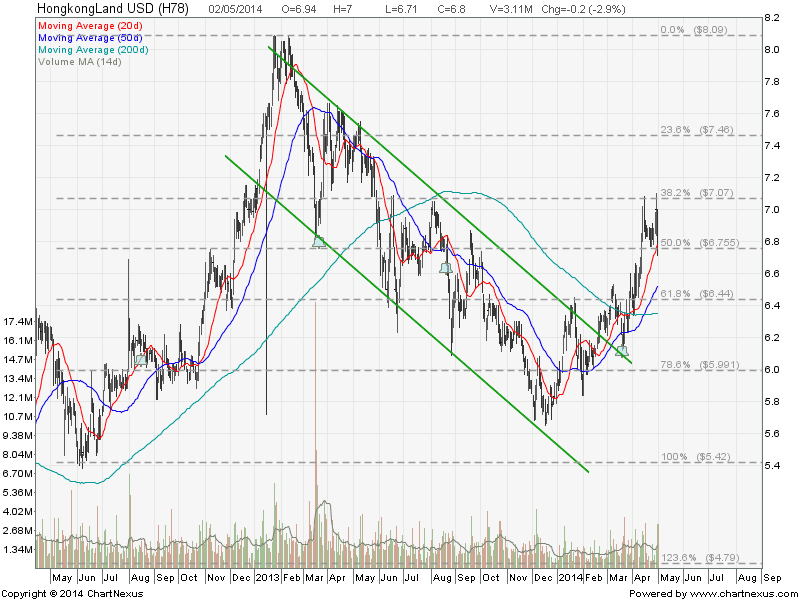
Hong Kong Land
It is very clear that Hong Kong Land broke out from the down trend channel and reverse into uptrend. Currently Hong Kong Land is facing resistance at $7.00 but the stock is very well supported by the 20D & 50D SMA.
Global Logistic Properties
GLP has not reversed to uptrend yet and currently testing the declining trend line resistance and fighting to break the 200D SMA resistance.

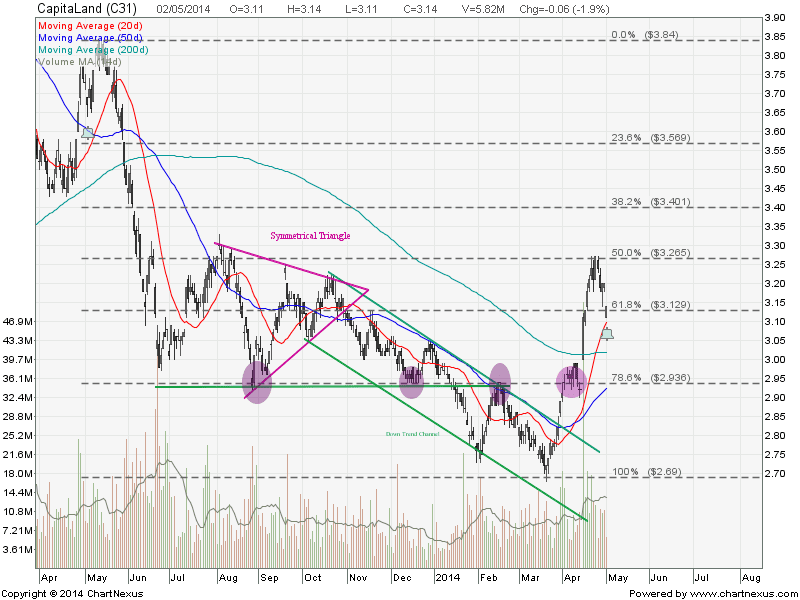
Capitaland
Capitaland has reversed to uptrend after finding a good support at $2.93. As long as Capitaland find the support at 200D SMA and $3.00 psychological level, the chart looks bullish. Fundamentally the valuation is very attractive with 17% discount to book value.
City Development
City Development had a sharp rally in April. $10.70 is a significant resistance turned support level to watch.

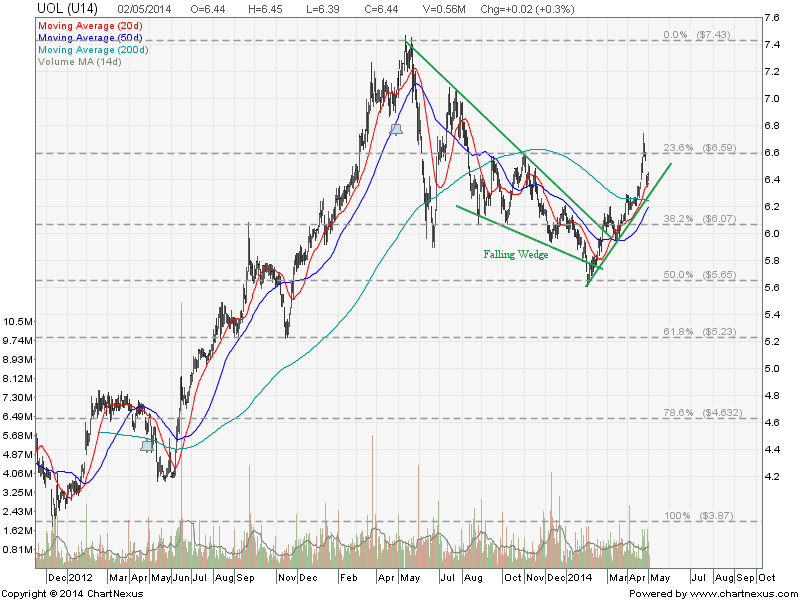
UOL
After breaking out from a Falling Wedge, UOL has reversed to uptrend and trading above the 20D, 50D and 200D SMA. Technically UOL retraces back to the uptrend support with 27% discount to book value fundamentally.
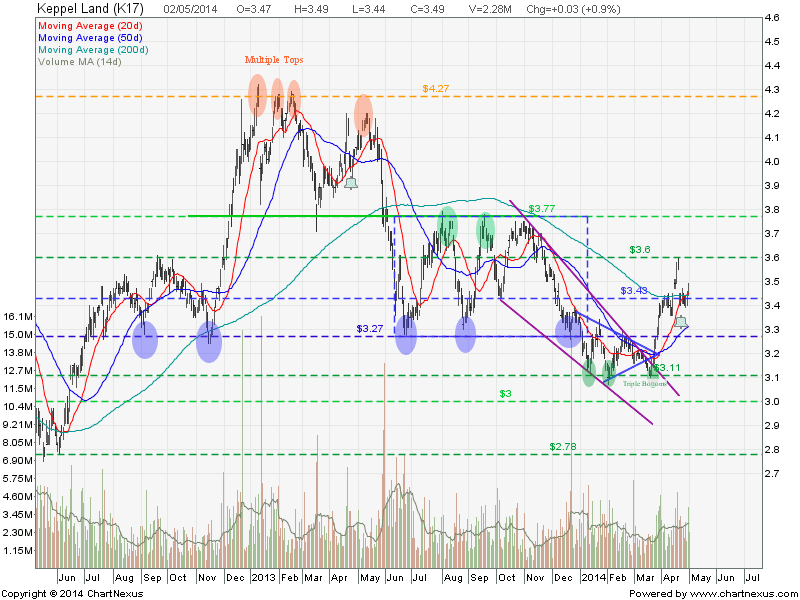
Keppel Land
Keppel Land looks like finding a good support at 200D SMA. Now need to watch for 20D & 50D SMA to catch up to confirm the uptrend.
Check here to learn how to use Technical Analysis to study the stock charts.