iPhone 6 Launch Impact on Apple (AAPL) Stock Price

  • Post author:

iPhone6 Impact on AAPL.

Technically AAPL chart is trading within an uptrend channel. All 3 moving averages are still trending up.

AAPL Sept20-2014

Fundamentally AAPL is still solid with forward PE only 14.18.

AAPL Sept20-2014 FA


AAPL Intrinsic Value

Last AAPL intrinsic value calculation using DCF method.

Fundamentally & Technically AAPL looks attractive with current price level.

Check out the Fundamental Analysis Class here if you want to understand how to analyse those Financial Ratio & calculate Intrinsic Value to determine whether the stock is good for investing, learn how to identify whether the stock is on uptrend, and more importantly, where to find important and free information from the internet to do your own research.


Continue ReadingiPhone 6 Launch Impact on Apple (AAPL) Stock Price

Apple (AAPL): Start Up Trend

  • Post author:

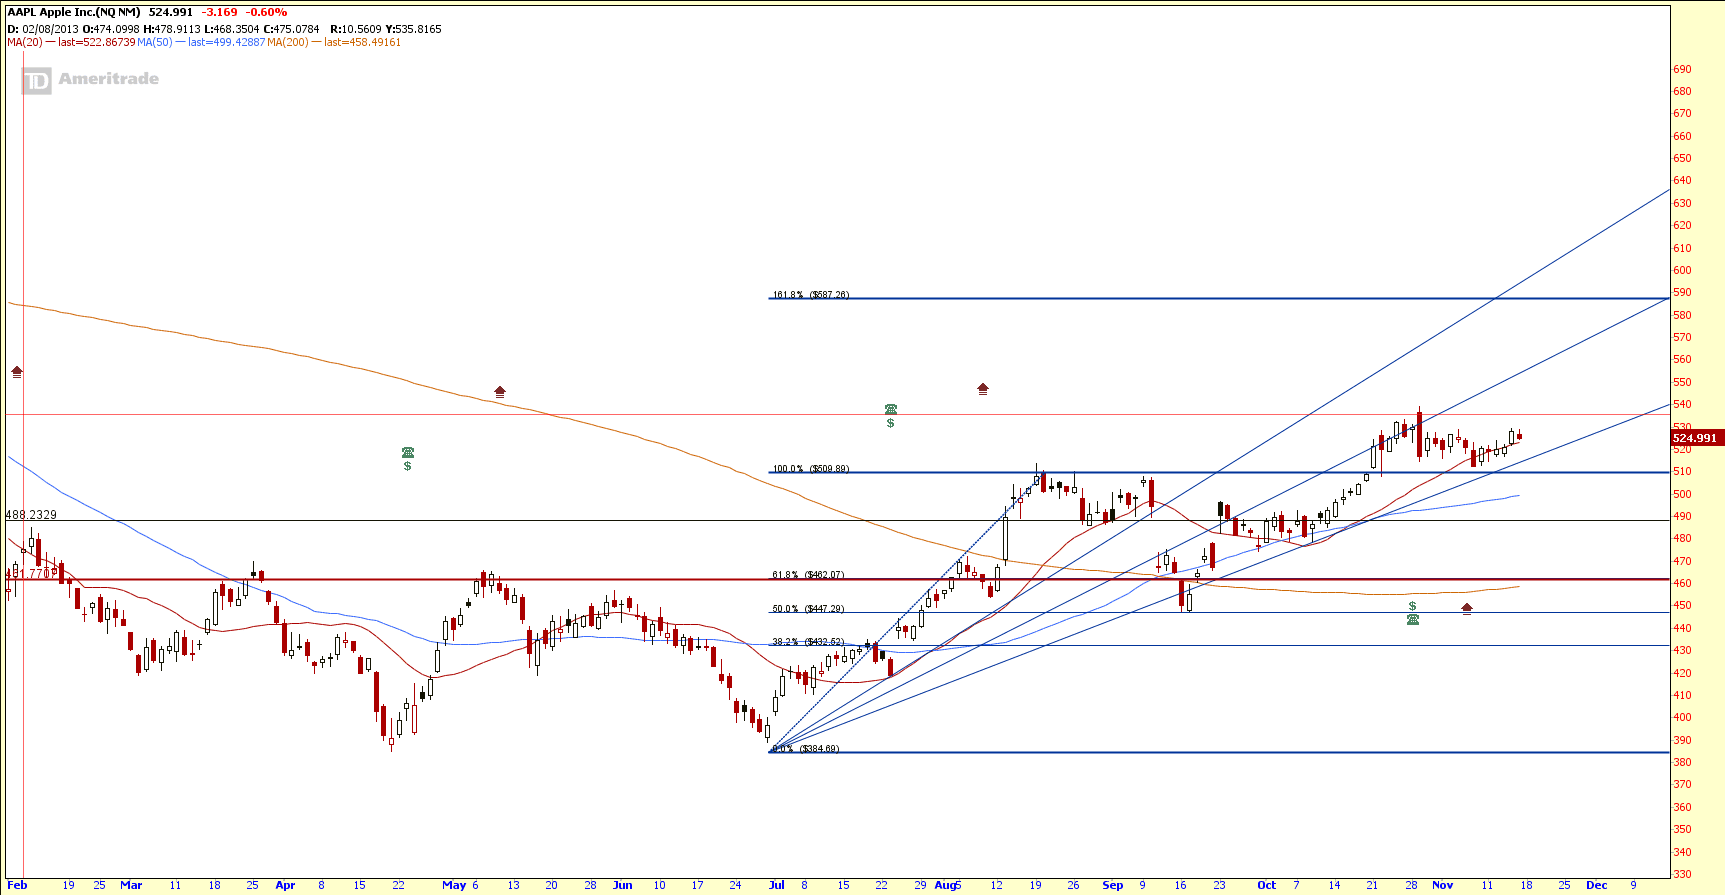
AAPL has broken the $510 resistance and currently trading in an uptrend. An “Higher High, Higher Low” up trend channel has been formed. In addition, AAPL is following a Fibonacci Expansion pattern and probably heading toward the price target of $587 (161.8% Fibonacci Retracement Level). So far the 61.8% Fibonacci Fans is providing a good support.

Check previous AAPL’s fundamental analysis and Intrinsic Value here.

Check out here if you want to learn about Fundamental Analysis and how to calculate Intrinsic Value using Discounted Cash Flow (DCF) model.

AAPL Nov17-2013

Chart from thinkorswim, get FREE chart here.

Continue ReadingApple (AAPL): Start Up Trend

Apple (AAPL) Trade Idea

  • Post author:

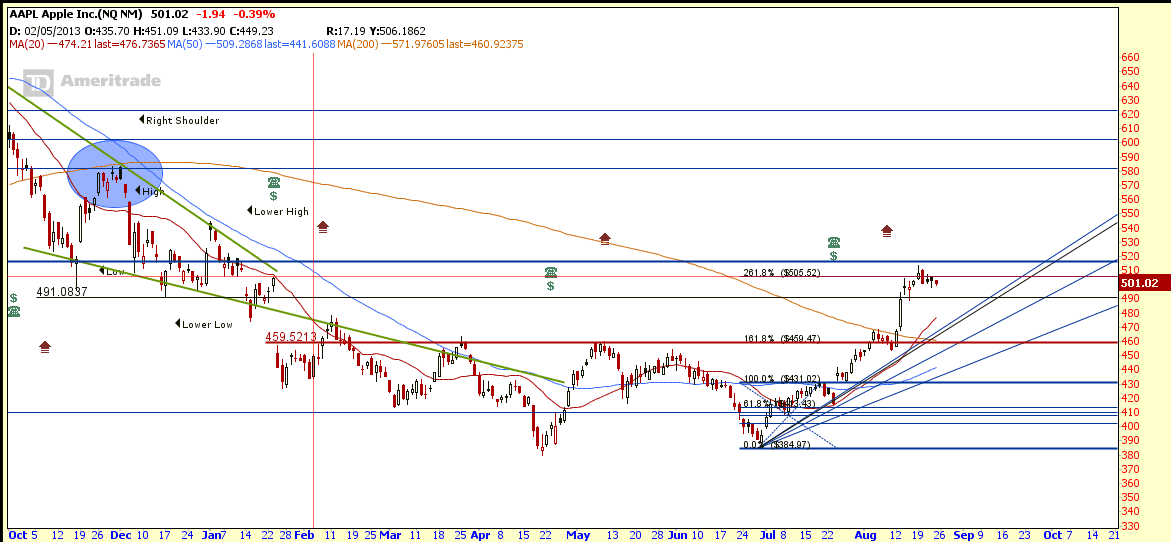
Chart Pattern: AAPL breakout from Inverted Head and Shoulders with neckline about $460. AAPL also broke the 200D SMA resistance and technically entered into bullish trend. The stock also retraced to retest the neckline support to confirm this is a successful breakout.

Trading Strategy: Short Put Spread.

  • Target Entry zone:
    • Scenario 1: $470-$480 when AAPL retraces back to Fibonacci Fan support. Currently AAPL is facing the 261.8% Fibonacci Resistance.
    • Scenario 2: If AAPL breakouts from current Bull Pennant / Bull Flag (above $510)
  • Scenario 1
    • STO AAPL Oct 13 480 Put
    • BTO AAPL Oct 13 470 Put
  • Scenario 2
    • STO AAPL Oct 13 510 Put
    • BTO AAPL Oct 13 500 Put
  • Minimum Price Target : $530 (Inverted Head and Shoulders Breakout Target)

AAPL Chart

AAPL Aug23-2013


AAPL Fundamental

AAPL Fundamental Aug23-2013

AAPL Intrinsic Value

  • Operating Cash Flow = $52,894 Million
  • No of Shares outstanding = 908.5 Million
  • Beta = 0.98
  • Discount Rate = 6%
  • No Growth (0% for next 10 years), IV = $443
  • Conservative Growth (5% for next 10 years), IV = $563
  • Moderate Growth (9% for next 10 years), IV = $709
  • Adjusted Growth Rate (12% for next 10 years). IV = $826


Chart from thinkorswim, get FREE chart here.

Original post by Marubozu from My Stocks Investing Journey.


Continue ReadingApple (AAPL) Trade Idea