Apple (AAPL) Super Under Value Stock But Don’t Catch the Falling Knife!

  • Post author:

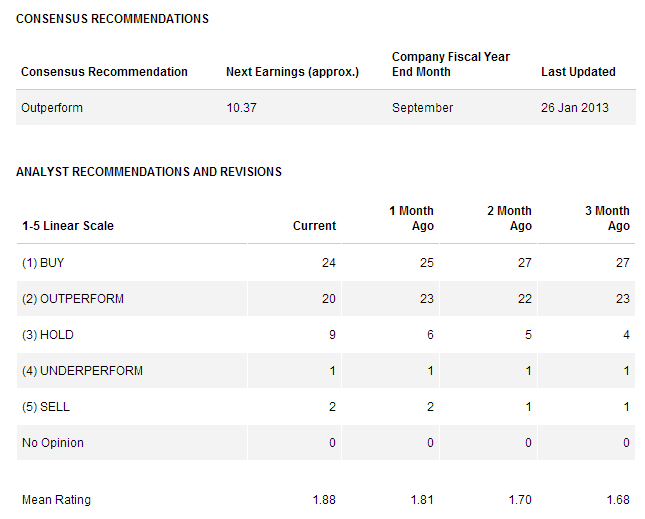
Don’t catch the falling knife although Apple (AAPL) is super under value now. Sarcastically most Analysts have a BUY or OVERWEIGHT call on AAPL but downgrade the target price. You are going to lose money if you just follow blindly the recommendation of the analysts. This is a classic example of combining Fundamental Analysis, Technical Analysis, Analyst Recommendation and the interpretation of Target Price, and develop a Trading Plan or Investment Plan.

Fundamental Analysis

  • Last Traded Price = $439.88
  • Current PE = 9.96
  • Forward PE = 7.73
  • PEG = 0.48
  • P/B = 3.49
  • Current Ratio = 1.50
  • Debt / Equity = 0
  • ROA = 28.54%
  • ROE = 42.84%

Using DCF Valuation Method

  • Intrinsic Value (7% annual growth rate for the next 10 years) = $713.54
  • Intrinsic Value (12% annual growth rate for the next 10 years) = $918.80
  • Operating Cash Flow = $56,728 Million
  • No. of Shares Outstanding = 939.06 Million
  • Beta = 1.08
  • Discount Rate = 5%
  • Debt per Share = 0
  • Cash per Share = $42.40
 
Technical Analysis
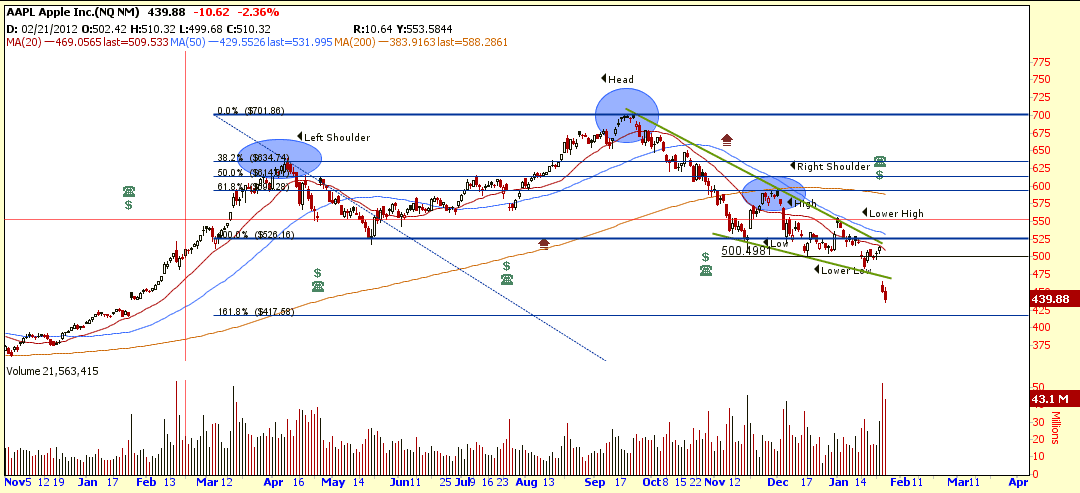
  • AAPL breakdown from a Falling Wedge with Price Target of about $400 (short term).
  • AAPL also breakdown from a Head & Shoulders with neckline at $525 and the price target is $350 (long term).
  • Currently AAPL is trading down trend below 20D, 50D and 200D SMA.
 

Last Analysis on AAPL.

Last Intrinsic Calculation for AAPL.


Recent Upgrade / Downgrade

24-Jan-13 Reiterated UBS Buy $650 → $600
24-Jan-13 Reiterated RBC Capital Mkts Outperform $725 → $600
24-Jan-13 Reiterated Oppenheimer Outperform $800 → $600
24-Jan-13 Reiterated Mizuho Buy $600 → $575
24-Jan-13 Reiterated ISI Group Strong Buy $710 → $600
24-Jan-13 Reiterated Deutsche Bank Buy $800 → $575
24-Jan-13 Reiterated Barclays Overweight $740 → $575
23-Jan-13 Reiterated FBR Capital Outperform $725 → $675
22-Jan-13 Reiterated UBS Buy $700 → $650
22-Jan-13 Reiterated Monness Crespi & Hardt Buy $750 → $670
16-Jan-13 Reiterated Stifel Nicolaus Buy $825 → $725
07-Jan-13 Reiterated Barclays Overweight $800 → $740
21-Dec-12 Reiterated RBC Capital Mkts Outperform $750 → $725
17-Dec-12 Reiterated Mizuho Buy $750 → $600
17-Dec-12 Reiterated Canaccord Genuity Buy $800 → $750
14-Dec-12 Reiterated UBS Buy $780 → $700


Analyst Recommendation


Continue ReadingApple (AAPL) Super Under Value Stock But Don’t Catch the Falling Knife!

Apple (AAPL): Forming a Falling Wedge

  • Post author:

AAPL is currently forming a Falling Wedge with resistance at about $540 & support at $500. Watch closely on AAPL because breakout from current chart pattern will trigger a big move for Apple.

A few bearish signals on current AAPL chart:

  • “Lower Low, Lower High” Down Trend pattern.
  • AAPL is trading below 20D, 50D and 200D SMA. 20D & 50D SMA are trending down and 200D SMA looks like turning down.
  • AAPL retrace back to 61.8% Fibonacci Retracement Level and rejected. Breaking below $500 support will send AAPL to 161.8% FR target of $417.58.

Although AAPL stock price is under value now but this is still not the right time to accumulate for long term investing. However, current AAPL chart is nice to trade but need to wait for the breakout, either a bullish trade or bearish trade.

Note: Earning on Jan 23, 2013.


Last Analysis of AAPL with Intrinsic Value calculated.

VALUATION RATIOS

COMPANY INDUSTRY SECTOR
P/E Ratio (TTM) 11.93 18.13 20.71
P/E High – Last 5 Yrs. 20.09 21.43 55.59
P/E Low – Last 5 Yrs. 14.61 10.70 11.85
Beta 1.10 1.14 0.92
Continue ReadingApple (AAPL): Forming a Falling Wedge

Is it the right time to pick up Apple AAPL?

  • Post author:
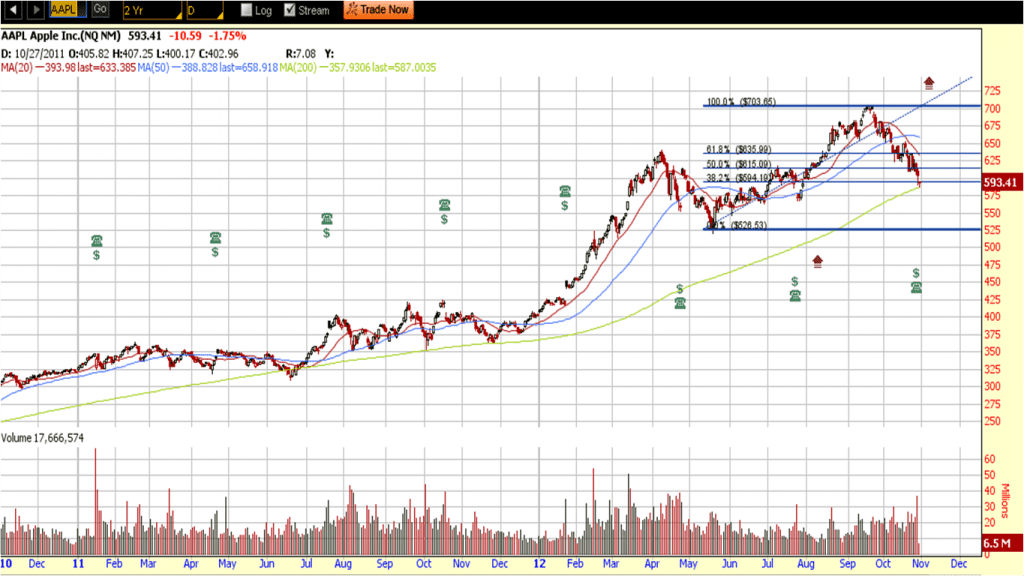
AAPL is getting near to 200D SMA, a very reliable support at about $587. I expect strong rebound at this level and just need to watch for a reversal candle to appear when the value investors jump into the trade.


Key Statistics for AAPL

Current P/E Ratio (ttm) 13.4293
Estimated P/E(09/2013) 11.8079
Relative P/E vs.SPX 0.9395
Earnings Per Share (USD) (ttm) 44.1600
Est. EPS (USD) (09/2013) 50.2240
Est. PEG Ratio 0.5523
Market Cap (M USD) 556,987.00
Shares Outstanding (M) 939.21
30 Day Average Volume 19,647,658
Price/Book (mrq) 4.7118
Price/Sale (ttm) 3.5413
Dividend Indicated Gross Yield 1.79%
Cash Dividend (USD) 2.6500
Last Dividend 11/07/2012
5 Year Dividend Growth
Next Earnings Announcement 01/24/2013
  • Intrinsic Value = $935 (WOW!!!).
  • 1-3 Years Growth Rate = 20% (conservative)
  • 4-10 Years Growth Rate = 15%
  • Net Operating Cash Flow = $50, 856 Million
  • Beta = 1.21
  • Discount Rate = 7%


Valuation Ratios

  Company Industry Sector
P/E Ratio (TTM) 13.68 12.10 21.78
P/E High – Last 5 Yrs. 20.09 21.06 52.06
P/E Low – Last 5 Yrs. 14.61 10.70 11.70
 
Beta 1.21 1.18 0.93
 
Price to Sales (TTM) 3.62 0.98 9.38
Price to Book (MRQ) 4.80 2.10 3.51
Price to Tangible Book (MRQ) 5.02 2.35 4.14
Price to Cash Flow (TTM) 12.58 10.41 11.78
Price to Free Cash Flow (TTM) 13.66 21.17 30.26

Recent Upgrade / Downgrade

24-Oct-12 Reiterated Canaccord Genuity Buy $797 → $800
13-Sep-12 Reiterated UBS Buy $740 → $780
13-Sep-12 Reiterated RBC Capital Mkts Outperform $700 → $750
13-Sep-12 Reiterated FBR Capital Outperform $675 → $725
13-Sep-12 Reiterated Deutsche Bank Buy $650 → $775
27-Aug-12 Reiterated Oppenheimer Outperform $680 → $800
22-Aug-12 Reiterated Needham Buy $620 → $750
09-Aug-12 Initiated Stifel Nicolaus Buy $825
Continue ReadingIs it the right time to pick up Apple AAPL?