STI: Fasten your Seat Belt! Storm Ahead!

  • Post author:

STI has been holding well for the past few days. Is STI consolidating for the next bull run or quiet before the next big storm? Let’s look at the three key indices…

Dow Jones Industrial


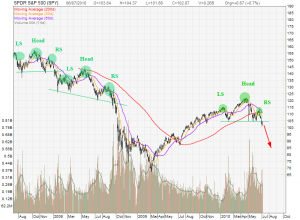
S&P500 ETF (SPY)

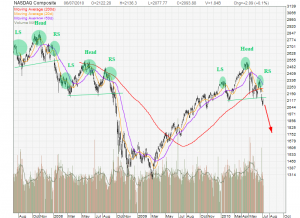
NASDAQ

What commonality do we see?

  • Head and Shoulders Pattern
  • Once the neckline is broken, sharp correction happens within one to two months.
  • All 3 key indices chart pattern are similar.
  • The LATEST Head and Shoulders has been formed and the neckline has been broken. Can you see what is coming?


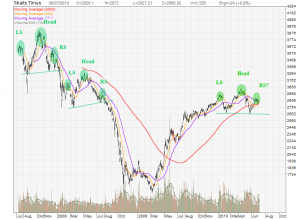
Let’s look at STI. Is the chart look familiar?

Someone will tell me “Hey! The Head and Shoulders has not been formed on STI yet!”

True! But my reply is “Do you think STI can escape from this storm and go on the bull run?”

STI: FASTEN YOUR SEAT BELT! STORM IS COMING!

Bull or Bear supporters, feel free to comment!


Continue ReadingSTI: Fasten your Seat Belt! Storm Ahead!

The Start of Bear Market?

  • Post author:

DOW Jones Industrial, S&P500 and NASDAQ Composite have all broken the 200D MA support. All three indices show similar chart pattern and currently traded at about 23.6% Fibonacci Retracement Level. There will be probably a short term bullish rebound from this support level before continuing the bearish down trend. Also take note that all three indices were unable to break the 50D MA resistance and turned down.

DOW JONES INDUSTRIAL

  • Resistance: 20D MA and 200D MA
  • Support: 10,109 (23.6% Fibonacci Retracement Level) and 10,000 (psychological support)
  • Target Correction Level: 9,428 (38.2% Fibonacci Retracement Level)

SNP 500

  • Resistance: 20D MA and 200D MA
  • Support: 1,094 (23.6% Fibonacci Retracement Level)
  • Target Correction Level: 1,014 (38.2% Fibonacci Retracement Level)

NASDAQ COMPOSITE

  • Resistance: 2,322 (previous resistance in Dec 2009) and 20D MA
  • Support: 2,230 (23.6% Fibonacci Retracement Level) and 200D MA
  • Target Correction Level: 2,046 (38.2% Fibonacci Retracement Level)


Continue ReadingThe Start of Bear Market?

Review of Key Indices Patterns

  • Post author:

DOW JONES INDUSTRIAL

  • DJI is at the top of channel resistance. If the index cannot break this channel resistance (about 10,500), it may retrace back to 10,100 level (close to channel support) in the coming one to two weeks.

S&P500 (SPY)

  • S&P500 has a similar uptrend channel pattern as DJI. If the index cannot break this channel resistance (about 112), it may retrace back to 107 (close to channel support) level in the coming one to two weeks.
NASDAQ COMPOSITE
  • NASDAQ is hitting a critical resistance at 2191 level. It is important to see whether NASDAQ can break this resistance and continue its uptrend. 
Straits Time Index (STI)
  • STI broke the previous resistance of 2,734 and continue its uptrend in a channel. 2,800 is a key resistance level and STI may retrace back to 2,670 (channel support) if STI is unable to stay above this resistance level.
Continue ReadingReview of Key Indices Patterns