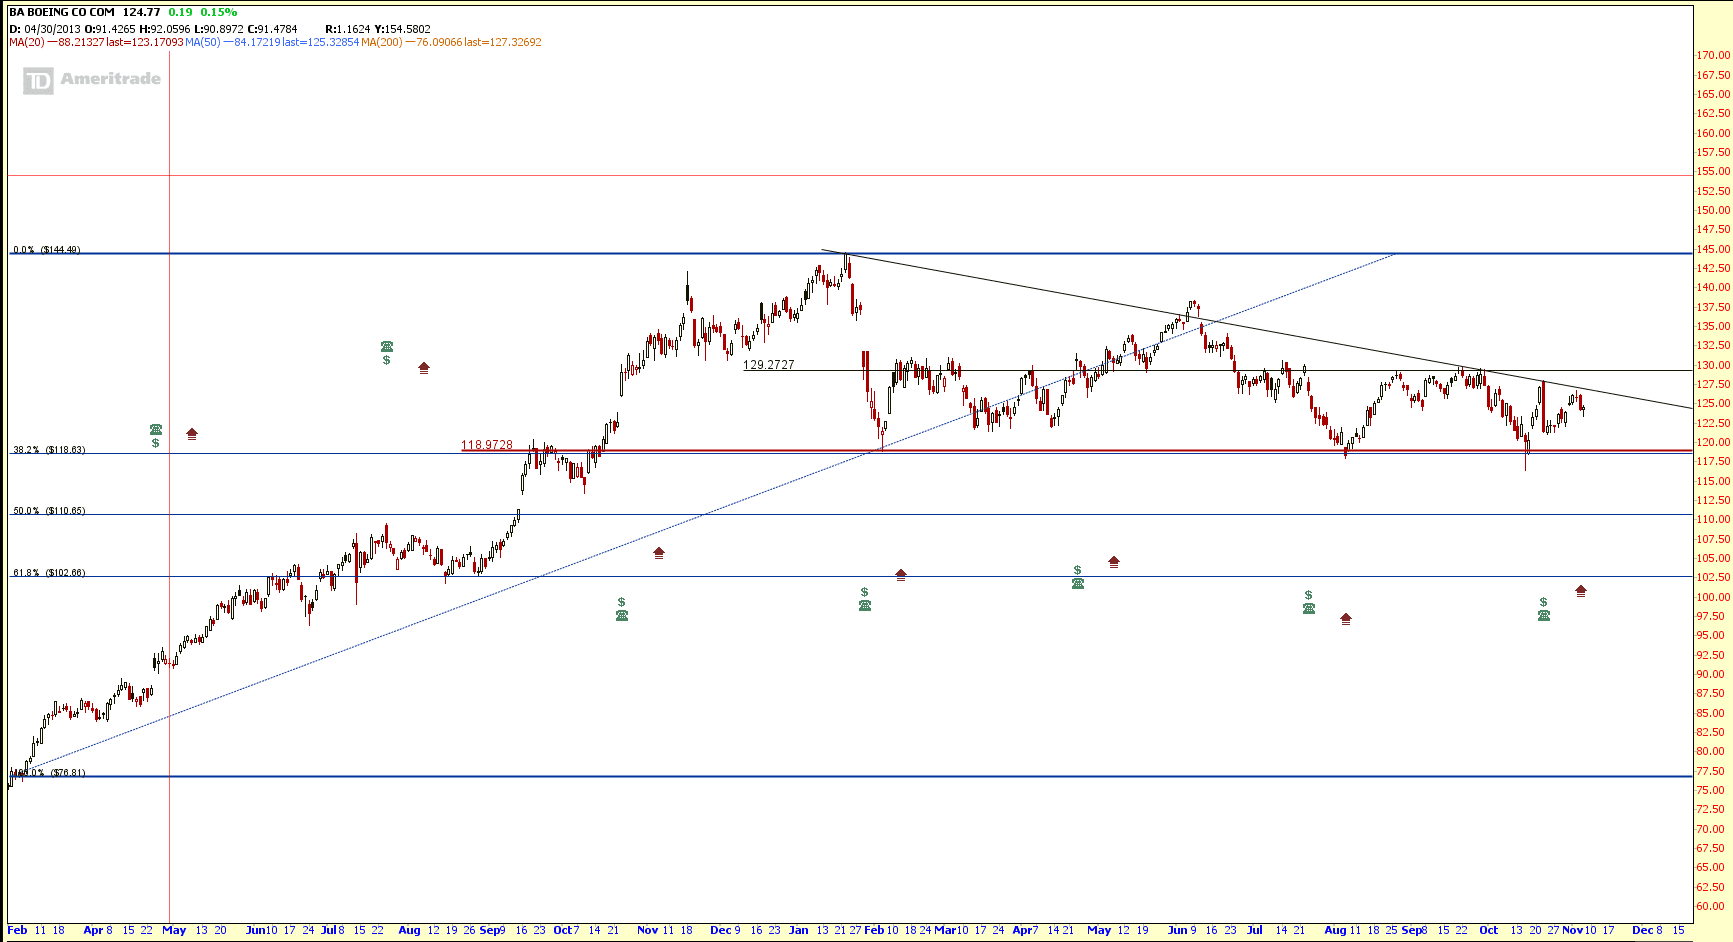
Boeing (BA): Descending Triangle
Boeing has been trading within a Descending Triangle consolidation mode for many months. This chart pattern is not for investor (cannot make money from buy low sell high strategy) because the stock price is moving side way.
However this chart pattern is very good for Option traders and range trader (using CFD) for short term trading.
Option Strategy
- Short Vertical Call Spread near Resistance – Bearish Direction
- Short Vertical Put Spread near Support ($119 has been a reliable support, also the 38.2% Fibonacci Retracement Level) – Bullish Direction
- Short Iron Condor between $117 and $131 – Non Directional & Premium Collection
- If $119 support is broken, Long Put if Vega is low.
Range Trading using CFD Strategy
- Short at Resistance (Declining Trend Line)
- Long at Support (at about $119)
- About $10 range
Original Post by Marubozu My Stocks Investing Journey