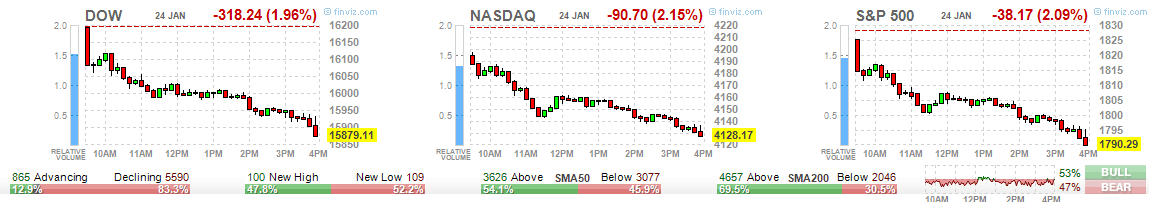
Dow Jones Industrial plunged more than 300 points on Friday. S&P500 and NASDAQ also dropped more than 2%. Basically ALL RED to celebrate the Chinese New Year! Is this the start of the long overdue stock market correction? Base on the stock market heatmap, looks like all sectors and worldwide stock market want to celebrate the Chinese New Year together!
Original post by Marubozu @ My Stocks Investing Journey.
Jan 24, 2014 (Friday) Market Snap Shot
Bear totally in-charged throughout the day. Bull was totally knocked out.
All red for S&P500 Heatmap. Only Microsoft (MSFT), Kimbely-Clark (KMB) and Procter & Gamble (PG) showed gain but don’t be fooled by this + gain because they closed the day with a bearish candle.

Industrial Goods sector is the worst performing sector and Utilities is the relative best performing sector. A typical pattern of a bearish market as Utilities is the defensive sector.

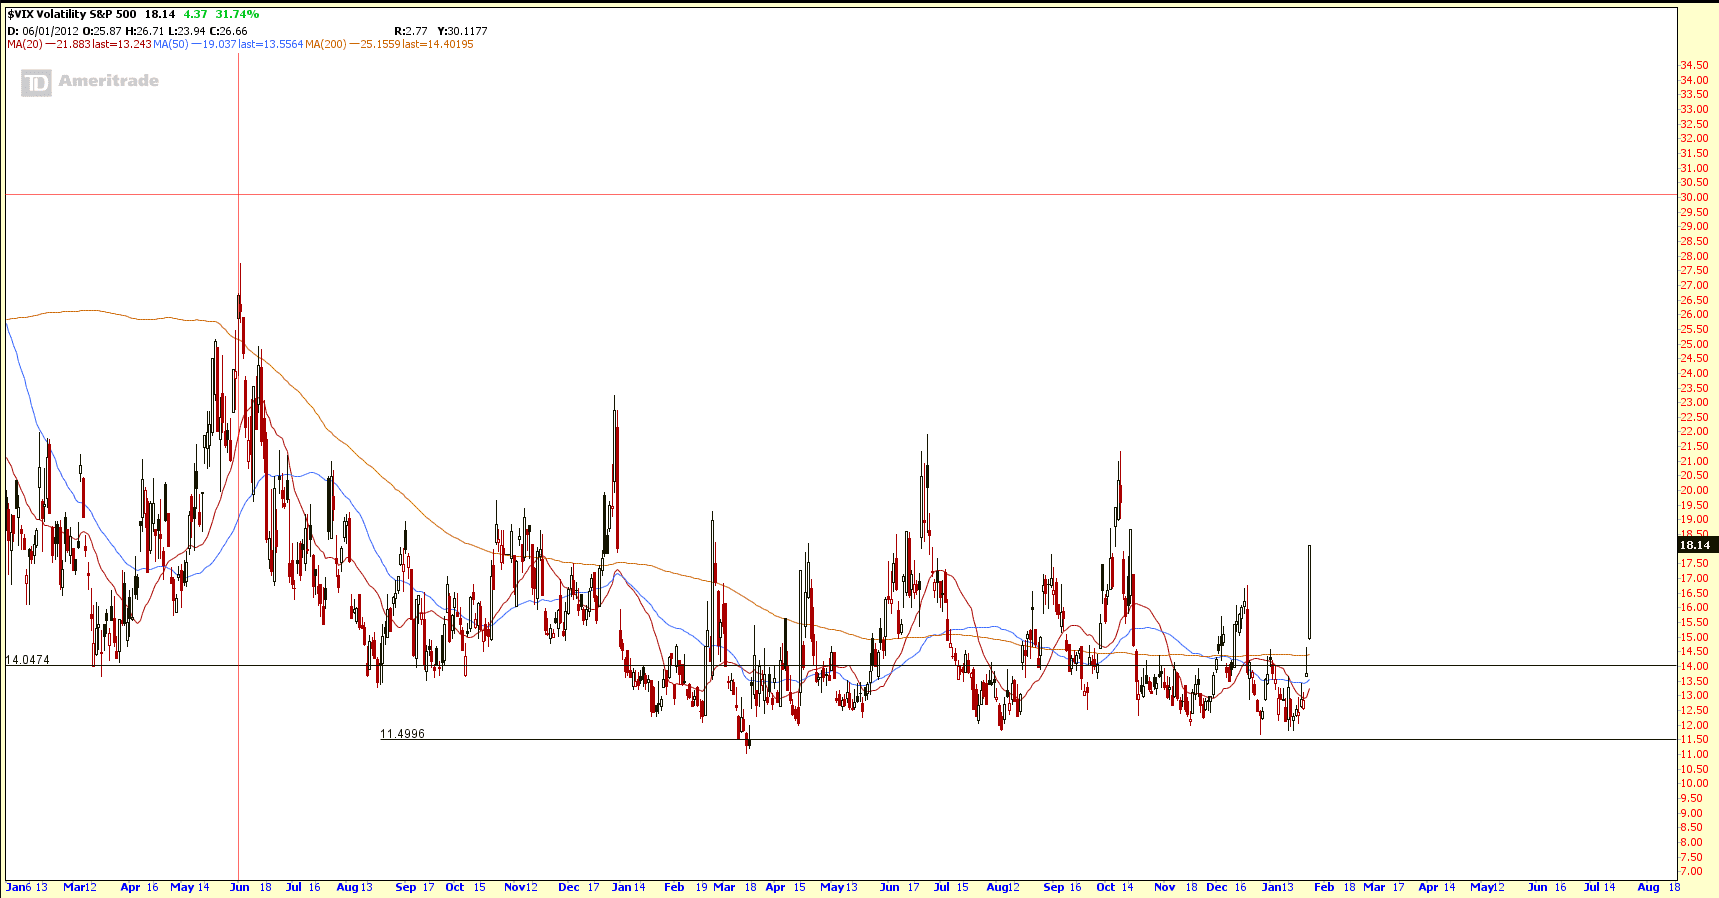
VIX jumped 31.74% to 18.14. This is a very bearish sign. If VIX does not drop in the next few sessions, expect more bloodshed in the stock market.
Only Short ETF (Bearish ETF) showed huge rally.
What is Short ETF?
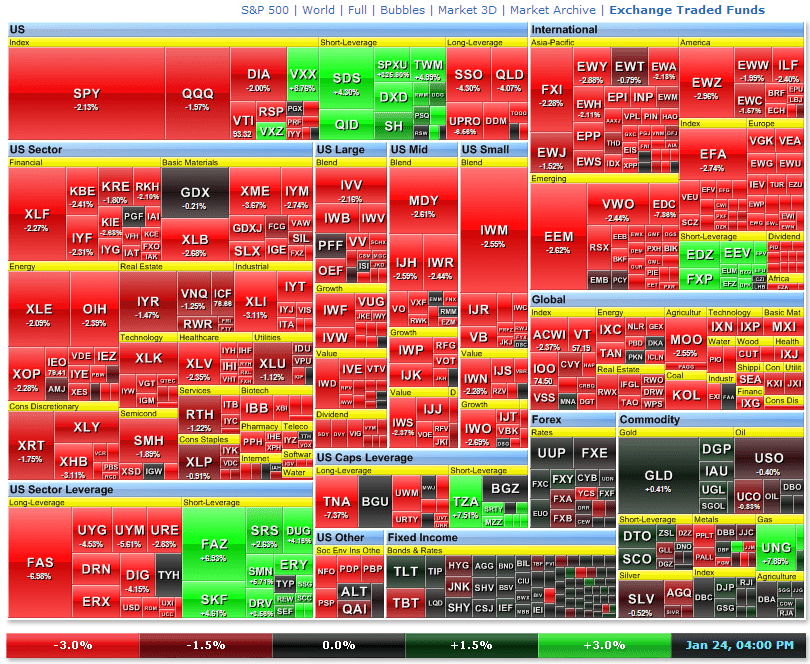
Worldwide Market showed all RED to celebrate the Chinese New Year.

Is the Bear Waking Up?
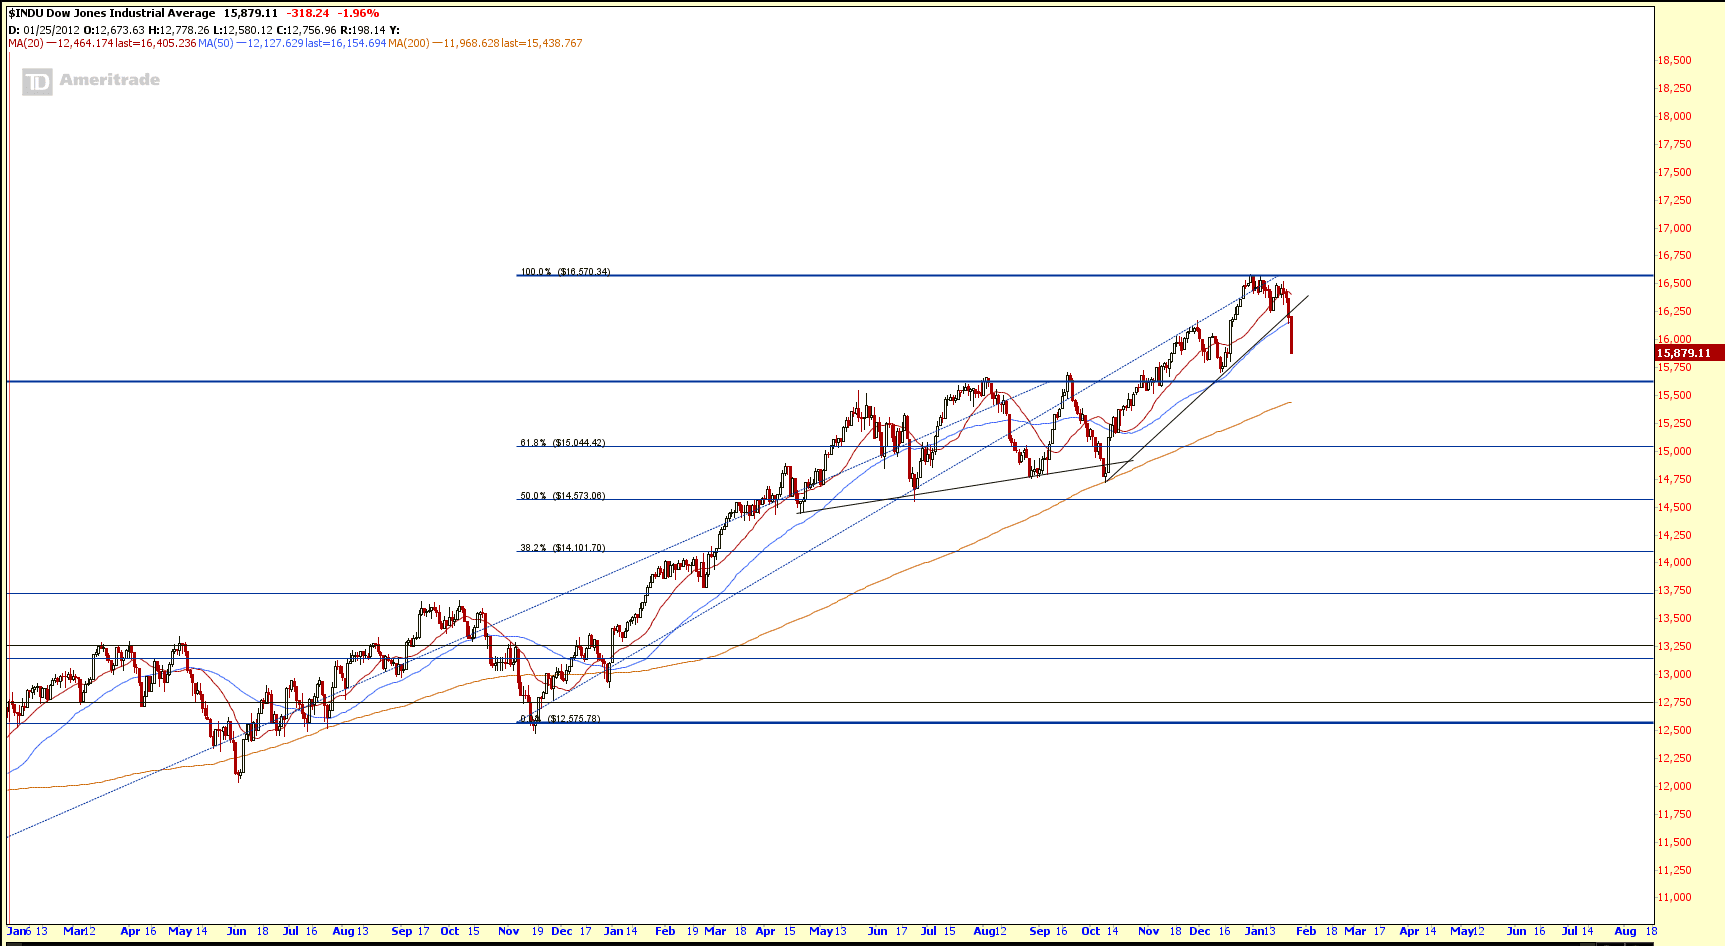
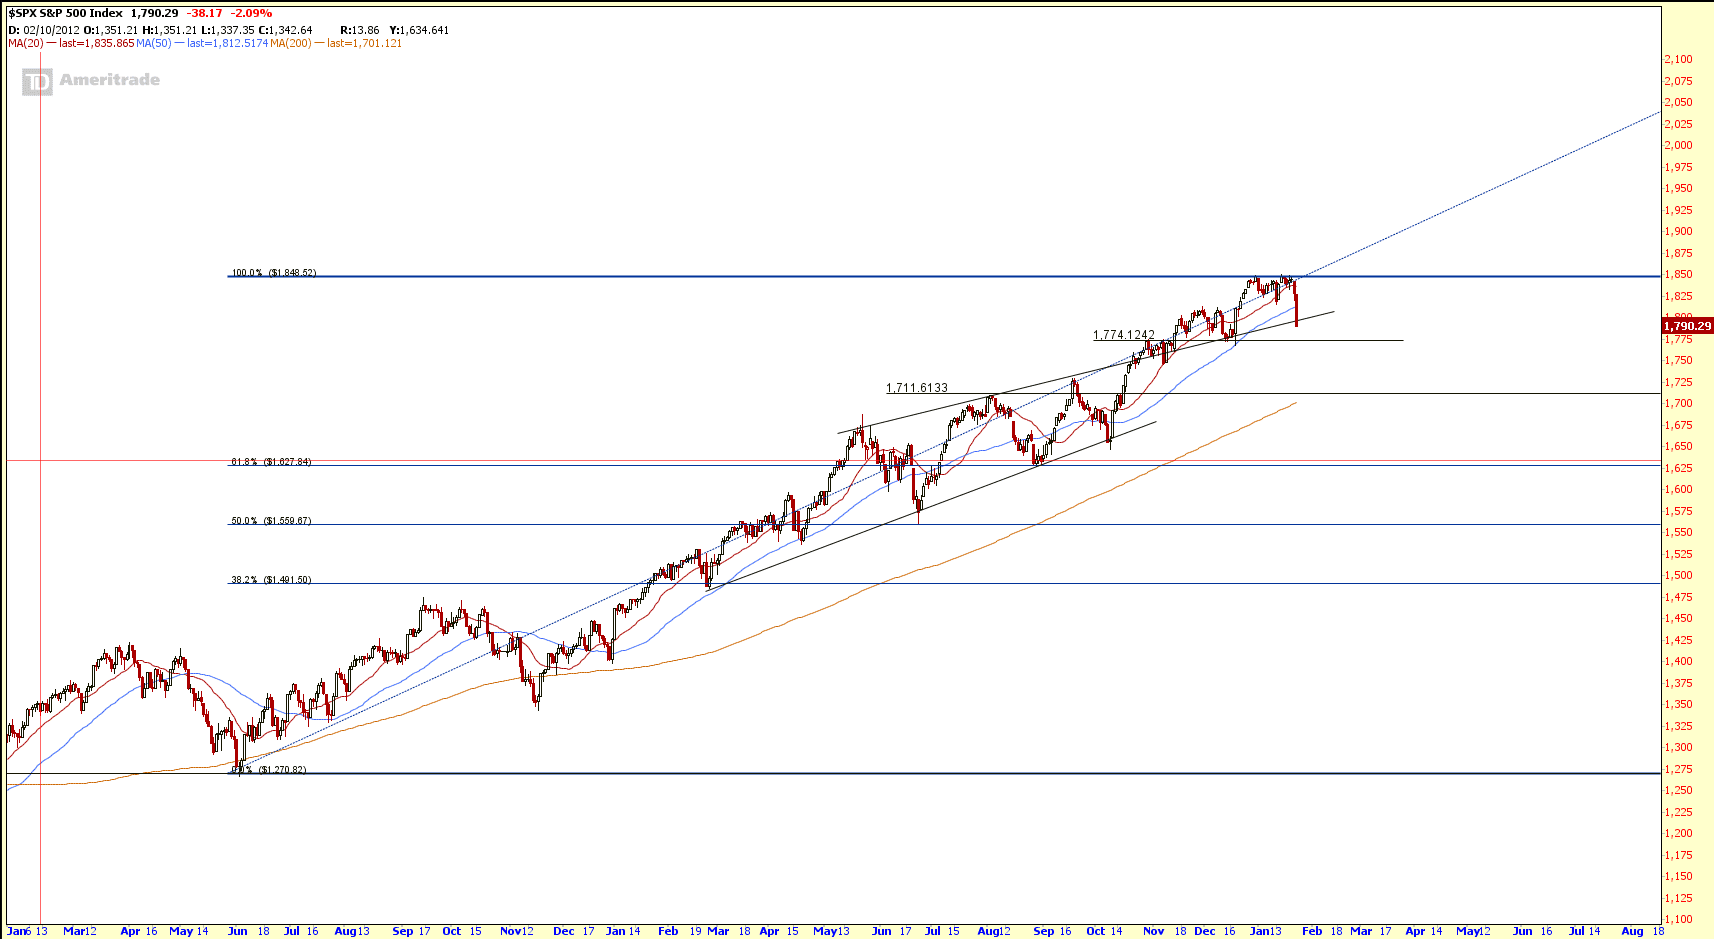
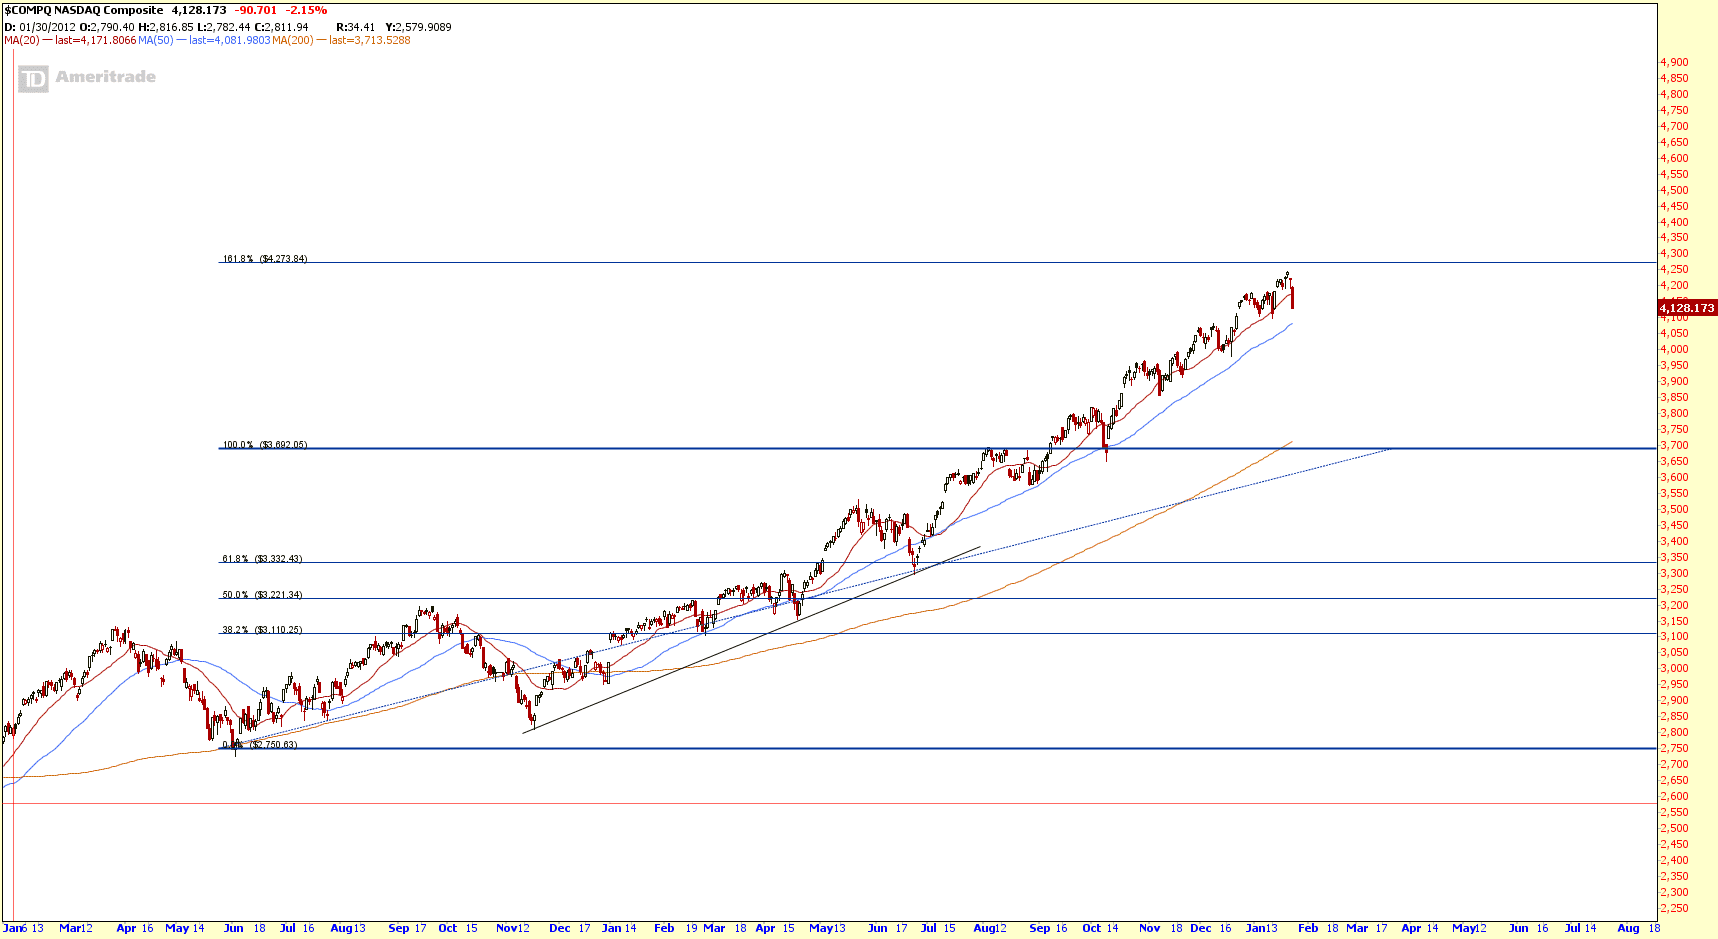
Dow Jones Industrial, S&P500, NASDAQ are still on the uptrend. The 200D SMA are still sloping up and technically the market is still on up trend. However, it is important to take note that currently the stock market is at the Market Top. Anything can happen at this juncture on top of the QE tapering. So, watch the support closely and also the chart pattern. If there is formation of Head and Shoulder, the right shoulder formation is the best chance for investors to get out.
What About Singapore Straits Time Index?
STI is trading in a Symmetrical Triangle with a critical support at 3024. This 3024 has been tested a few times (resistance turned support). More down side to come if this support is broken. Technically STI is in bearish consolidation territory and 200D SMA is sloping down now.

Summary
There are signs that the Bear has just woke up. It is still at early stage. The US Stock Market may be starting a little correction and continue the uptrend. Watch the support closely and trade base on what we see. This is not the good time to “hope” market can continue to go up and living in denial if we are seeing red in our portfolio. Tighten your stop loss, hedge your portfolio, prepare to cut loss or prepare to SHORT!
Wish everyone a Happy Chinese New Year but it depends on how we make decision and what we want to see in our portfolio (red or green)!