Key US Market Indices Review: Reversal At Sight!

  • Post author:

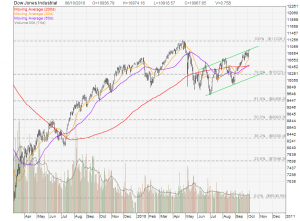
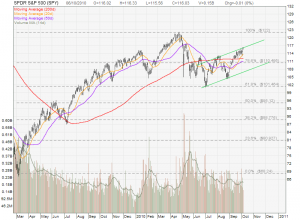
All three key US Market Indices (Dow Jones, S&P500, NASDAQ) are hitting the uptrend channel resistance.  Immediate support is the 20D MA. If these three Moving Average supports are broken, these market indices will be sent to the uptrend support. This month is the month of October when most crashes happen in this month historically. Earning season is starting soon when the companys report last quater earning. I expect lots of earning downgrade because I am seeing slowing down in economy for the next two quarters.

Dow Jones Industrial

S&P500 (SPY)

NASDAQ
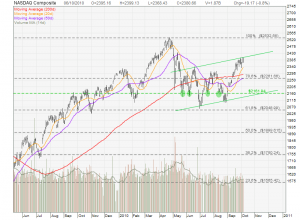
Sept has been a bullish month, What goes up must come down…. I may be wrong but I will not lose money if I am taking a safety first , wait and see approach without committing any additional money in the market.

Trade with extreme cautious!

Continue ReadingKey US Market Indices Review: Reversal At Sight!

DryShips (DRYS) – Bottom Fishing Time

  • Post author:

DryShips has been beaten down badly due to poor BDI index. However it may been a good time to do bottom fishing on DRYS in anticipating the economy recovery and also many countries need coal for the winter period. Such activities will increase the dry bulk shipping demand and thus drive the BDI index up. DRYS stock price has very high correlation with the BDI index. DRYS hit US$130 and US$115 respectively when BDI hit the peak (> 10,000) in Nov 2008 and May 2009.

Currently DRYS is trading about US$4.00 and current BDI index is about 1,700. If you look at the downside risk (lowest is US$2.72) versus the upside potential (historial high US$130), it looks very attractive for long term investment. However, if the economy does not recover as per plan, BDI will drop further. Is it worth the gamble? Your Call!

Continue ReadingDryShips (DRYS) – Bottom Fishing Time

STI: Fasten your Seat Belt! Storm Ahead!

  • Post author:

STI has been holding well for the past few days. Is STI consolidating for the next bull run or quiet before the next big storm? Let’s look at the three key indices…

Dow Jones Industrial


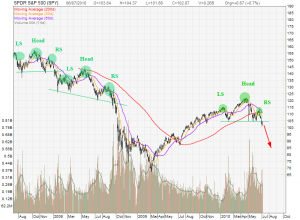
S&P500 ETF (SPY)

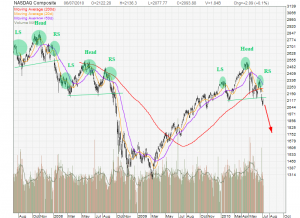
NASDAQ

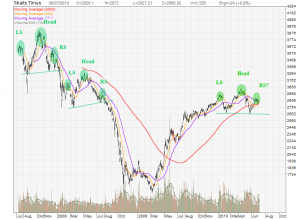
What commonality do we see?

  • Head and Shoulders Pattern
  • Once the neckline is broken, sharp correction happens within one to two months.
  • All 3 key indices chart pattern are similar.
  • The LATEST Head and Shoulders has been formed and the neckline has been broken. Can you see what is coming?


Let’s look at STI. Is the chart look familiar?

Someone will tell me “Hey! The Head and Shoulders has not been formed on STI yet!”

True! But my reply is “Do you think STI can escape from this storm and go on the bull run?”

STI: FASTEN YOUR SEAT BELT! STORM IS COMING!

Bull or Bear supporters, feel free to comment!


Continue ReadingSTI: Fasten your Seat Belt! Storm Ahead!