UNG – Return to the Falling Wedge

  • Post author:

UNG failed the breakout from the channel and returned to the falling wedge. $9.00 is a critical support level and if UNG bounces back from this support, a double bottom will be formed. If this support is broken, UNG will continue to go south to its historical low until the next support of $7.072. Formation of either a double bottom pattern or breakout from a falling wedge in a down trend will reverse a trend (i.e. the stock price will move up eventually). As I am planning to invest this ETF for long term, this analysis gives me some idea where I can accumulate more shares at a lower price.

Continue ReadingUNG – Return to the Falling Wedge

Goldman Sachs and Apple – Get Ready to Short!

  • Post author:

I am preparing to short (buy PUT option) Goldman Sachs (GS) & Apple (AAPL) if the charts pattern are confirmed bearish.

Goldman Sachs (GS) appears to be forming a Head & Shoulders pattern. I am waiting for the right shoulder to be formed. The stock has been on the up trend since Mar 2009 and is due for a healthy correction. The 50D MA provides a very strong support line as the stock price bounced back twice in beginning of July and early Sept.

Things to watch out for GS:

  • Whether the right shoulder is formed?
  • Can the stock price breakdown the 50D MA support (probably concides with the neckline if H&S pattern is formed)?

Apple (AAPL) broke the 20D MA with a long bearish candle last Friday. The long term channel resistance which also coincides with its 50D MA trend line at about $185, is a critical support. Falling below this support could start the correction and see the price fall to $158.19 level (61.8% Fibonacci Retracement Level). Both MACD and RSI are bearish. MACD had confirmed its dead crossover and RSI broke its support trend line.

Things to watch out for AAPL:
  • Whether the stock price breakdown from the long term up trend channel resistance?
  • After the support is broken, whether AAPL can move back to the channel (i.e. the channel support become very strong resistance to prevent AAPL to move back to the channel)?
Continue ReadingGoldman Sachs and Apple – Get Ready to Short!

DRYS – Breaking Critical Supports!

  • Post author:

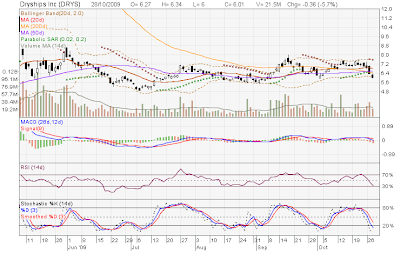
DRYS chart looks very bearish as DRYS broke down the Wedge channel support. The stock price is currently below 20D, 50D and 200D MA. Another scary thing is DRYS 200D MA is heading south implies that the DRYS is still on the long term down trend.

Technical Indicators also confirm that DRYS is bearish:
  • Stock price is at the lower Bollinger Band.
  • Stock price is below the Parabolic SAR.
  • MACD is moving into lower half of the graph.
  • RSI and Stochastic are heading south.
Continue ReadingDRYS – Breaking Critical Supports!