Author: Conor Doherty
If you have a pension or investment ISA, it is likely that you have shares in a company.
Shares are portions of a company owned by investors when a business lists or goes public on the stock market.
The price of a share is set by the value of the company and the amount of stock available, this goes up and down depending on confidence and performance of the business.
Once you have a share in a company, you then become a shareholder, which in some cases means you can have a say on its decisions depending how much stock you own.
More adventurous investors can trade in price movements through spread betting or contracts for difference.
.
Why invest in shares?
The main reason for buying shares is to make money from the company growing or from the dividends or payments that investors receive from annual profits.
Another benefit of dividends is that investors can reinvest them and boost their returns without having to commit any new money.
If a share price rises, your investment value will increase, but it will also fall if the price drops.
A share is different to a savings account or bond as there is no guarantee of the return you will get and you could lose money if a company does badly or collapses.
.
How much does share dealing cost?
The amount you pay for a share is determined by its price, the risk, and the broker or platform you are using.
Platforms can charge as little as £2.50 per trade but some will have annual account fees.
There is also Stamp Duty of 0.5 per cent to pay on share purchases.
Shares prices can sometimes fall below 1p, which sounds cheap but can be a warning sign that a company is doing badly.
.
What makes prices change?
Share prices are dictated by confidence and profits. If investors think a company is doing well or is set to improve, you will happily put money in, pushing the price up.
But it will go down if confidence is low.
Company shares can also be dragged up or down by the rest of the stock market or the sector they work in
The key is to time your investment right so you don’t put money in at the wrong time and try to spot decent shares before others while the price is low.
Cheap shares can be a buying opportunity, but you need to be sure the price won’t fall further.
This is why it is important to research companies before investing.
.
How do you value a company?
It is hard to predict the future, but there are pieces of company information that will indicate its financial health.
Its most recent profits will show how well a company is doing. Also, check the balance sheet for its assets and liabilities as this shows how much money is coming in and out and how much debt there is.
Another method is to compare a company’s share price with its competitors and assess how valuable it is.
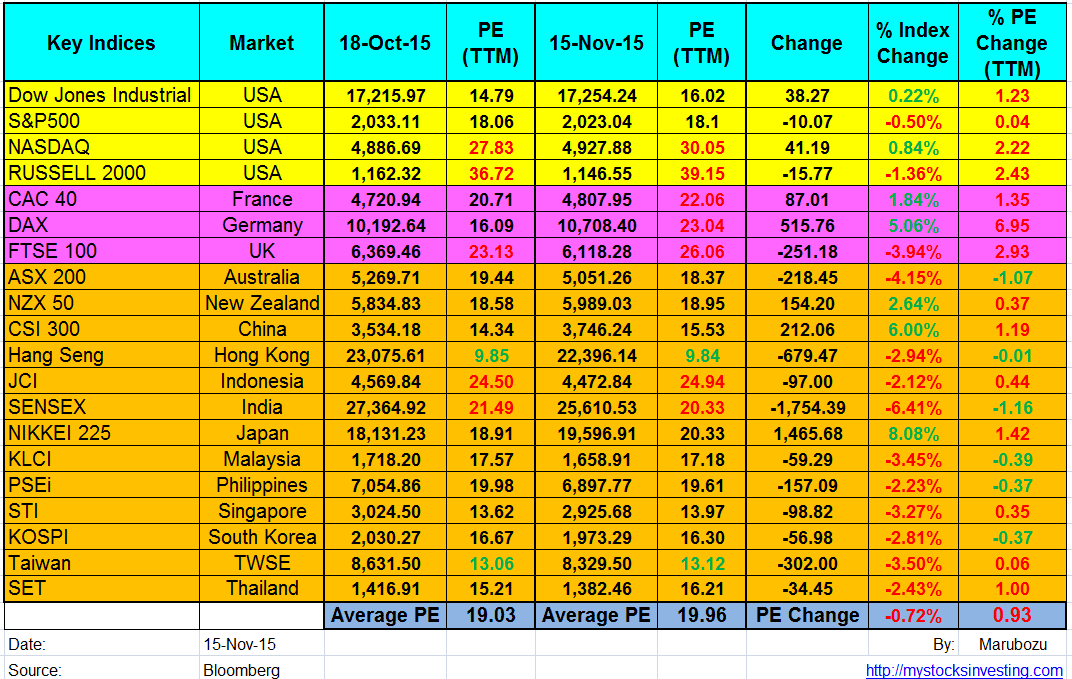
This can be done using the price-to-earnings ratio, which compares the share price with the amount of profits it makes per share.
For example, a company with a P/E of five is valued lower than one with 20. This may mean it has poor prospects or that it is being overlooked.
.
How to choose a stockbroker?
You can trade shares or Forex through a broker or trading platform. Prices vary depending on how often you want to trade and the type of account you want as well as the assets you want to access.
Some will let you just do it yourself, while others will provide guidance and discretionary portfolios for an extra charge.
You can check the permissions of your broker and platform on the Financial Conduct Authority website.
Shares are not for everyone and you have to be prepared for good and bad times.
You won’t necessarily get rich straight away, but you will get the best out of your portfolio by making well-informed decisions and keeping your dealing costs down.