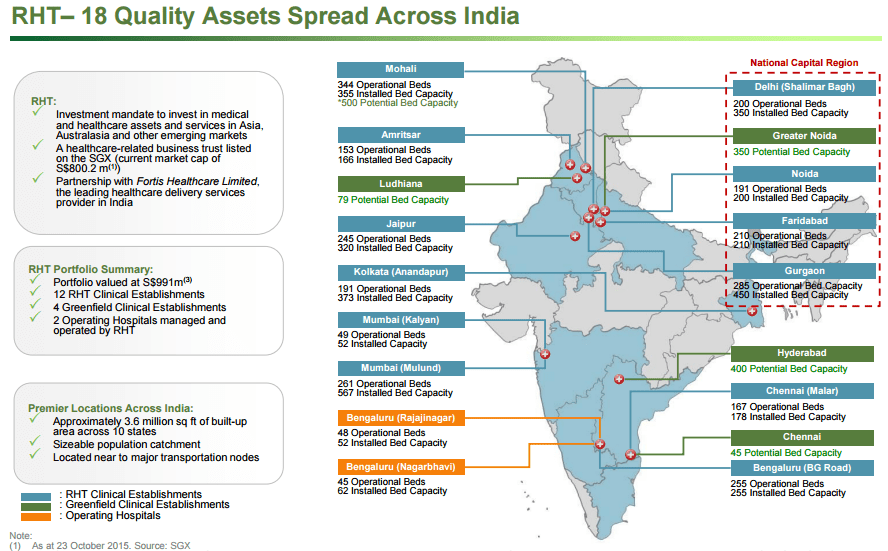
Religare Health Trust: Defensive Healthcare Passive Income Stock Pick with Risks
![]()
Religare Health Trust Quarterly Earning Result Nov 5, 2015
- Last Done Price = $1.02
- Market Cap = $1.39 B
- NAV = $0.946
- Price / NAV = 1.078 (7.8% Premium)
- Price / NAV (High) = 1.27
- Price / NAV (Low) = 1.00
- Distribution Yield = 7.647%
- Gearing Ratio = 14.7% (38.6% with acquisition of Mohali and Development Project)
- WADM = 2.2 Years
Singapore REITs Fundamental Analysis Comparison Table


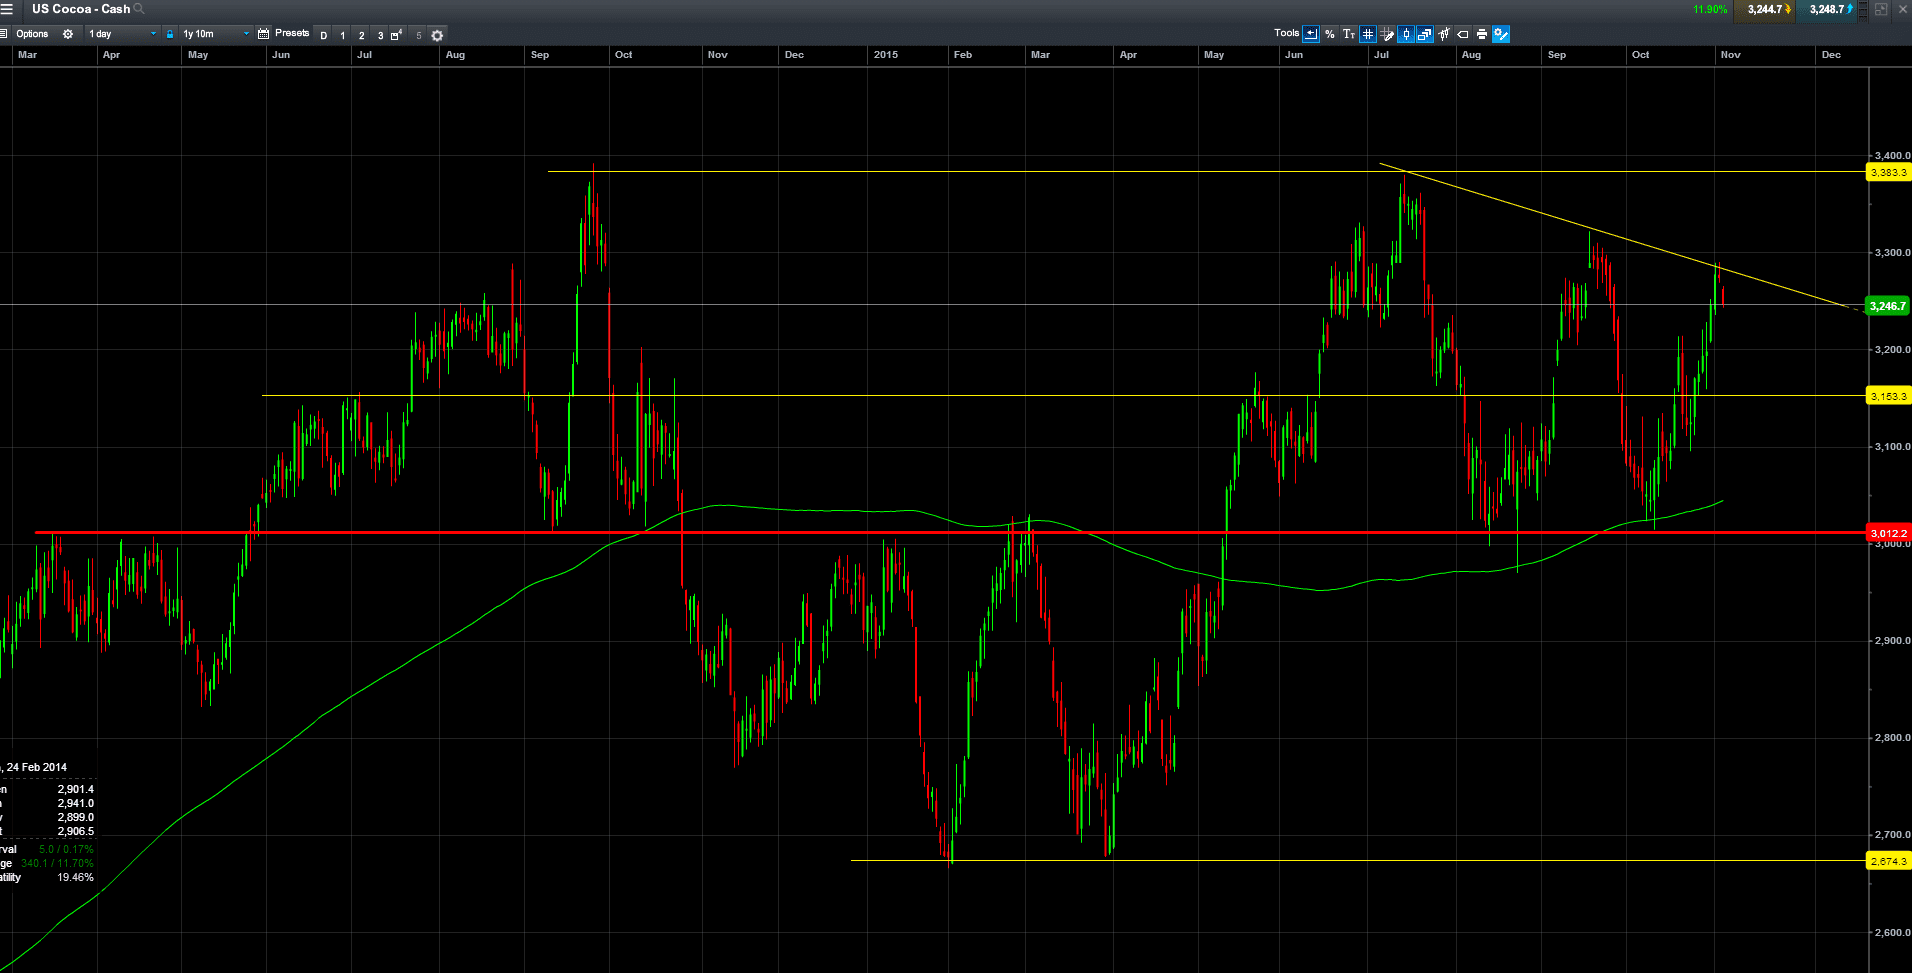
Religare Health Trust Technical Analysis & Stock Chart

Religare Health Trust rebounded strongly and currently trading around the 200D SMA. There is limited upside potential as the stock price is trading near the historical high although the distribution yield and Price / NAV looks attractive. Three main risks to sustainability of DPU: Business Trust, Forex and Debt Profile.

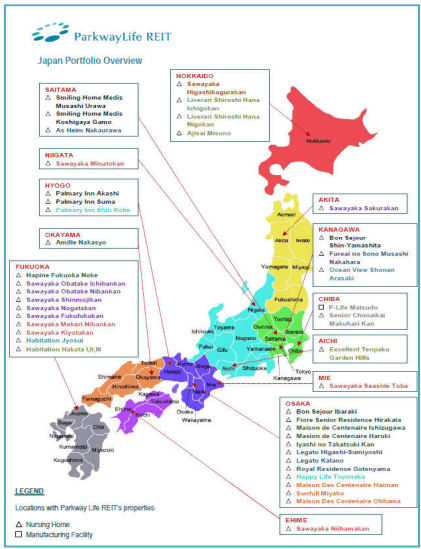
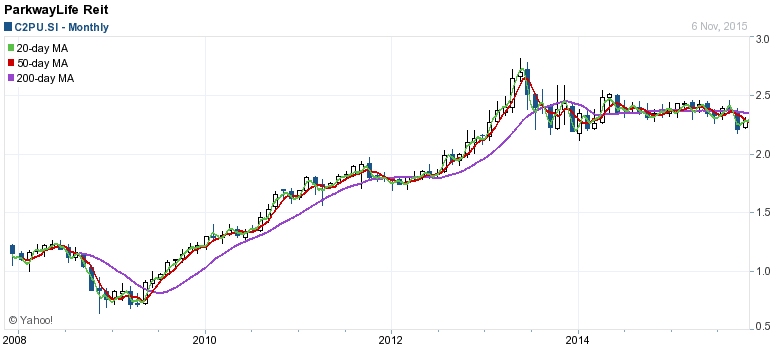
Two other similar Healthcare related stocks are FIRST REIT and Parkway Life REIT to compare with Parkway Life REIT. Check out Singapore REIT Course here on how identify the RISKS of dividend sustainability of Singapore Healthcare REIT. https://mystocksinvesting.com/course/singapore-reits-investing/