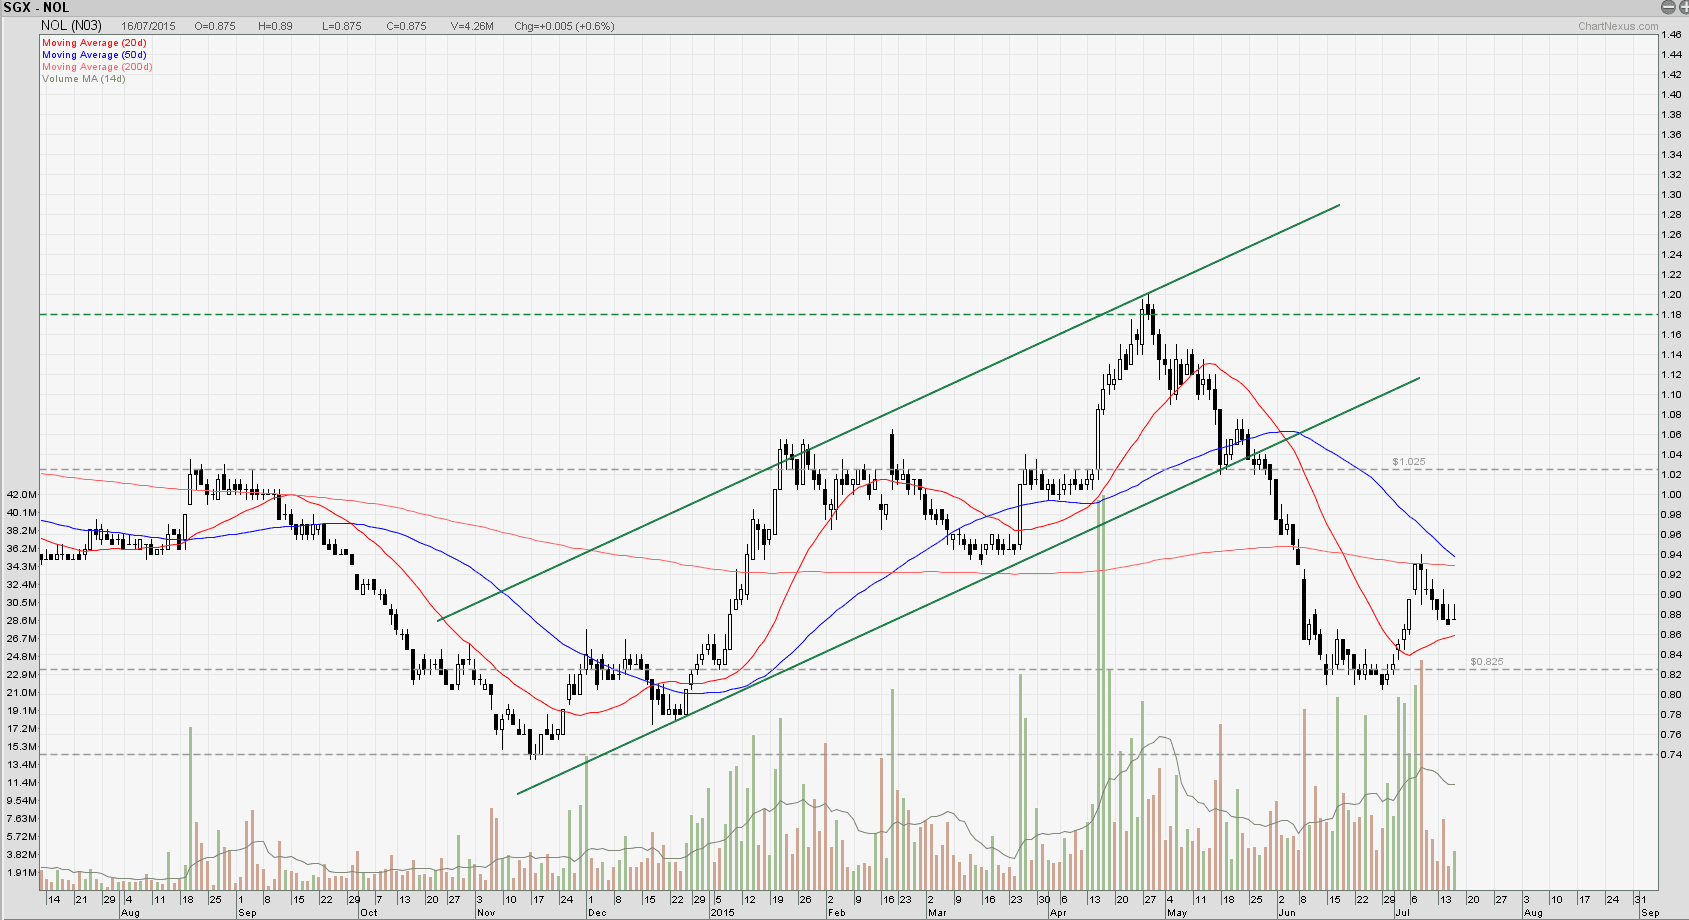
NOL: Rejected at 200D SMA Resistance
NOL rejected at 200D SMA with a Hanging Man candlestick pattern. Expect more down side.
Learn how to identify trend reversal using candlestick patterns, check out the Technical Analysis Hands on class here.
NOL Fundamental Data
- Last Done Price = $0.875
- Market Cap = 2.3 B
- EPS = -$0.13214
- PE Ratio (TTM) = N.M
- PE High (Last 5 Years) = 9.54
- PE Low (Last 5 Years) = 9.54
- P/B Ratio = 0.96
- Dividend Yield = N.A
- ROA = N.M
- ROE = N.M.
- Current Ratio = 1.171
Learn how to use Financial Ratio to analyse the stocks, check out the Fundamental Analysis class (hands on research) here.
Fundamentally and Technically NOL is a good stock to short! However, beware of the rumor in the news below. Current price is close to the book value of $0.9147.
Singapore’s Temasek puts up shipper Neptune Orient Lines for sale -WSJ