Mapletree Industrial Trust Fundamental and Technical Analysis

  • Post author:

Mapletree Industrial Trust Fundamental Analysis on May, 2015.

  • Last Done Price = $1.56
  • Market Cap = $2.75 B
  • NAV = $1.32
  • Price /  NAV = 1.18 (18% Premium)
  • Price /  NAV (High) = 1.46
  • Price /  NAV (Low) = 1.16
  • Distribution Yield = 6.795%
  • Gearing Ratio = 30.6%
  • WADB = 4.2 Years
  • WALE = 3.1 Years
  • Occupancy Rate = 90.2%

Mapletree Industrial Trust DPU History June28-2015Mapletree Industrial Trust Structure June28-2015Mapletree Industrial Trust Diversification June28-2015 Mapletree Industrial Trust Occupancy June28-2015 Mapletree Industrial Trust Top 10 Tenants June28-2015 Mapletree Industrial Trust WADM June28-2015 Mapletree Industrial Trust WALE June28-2015

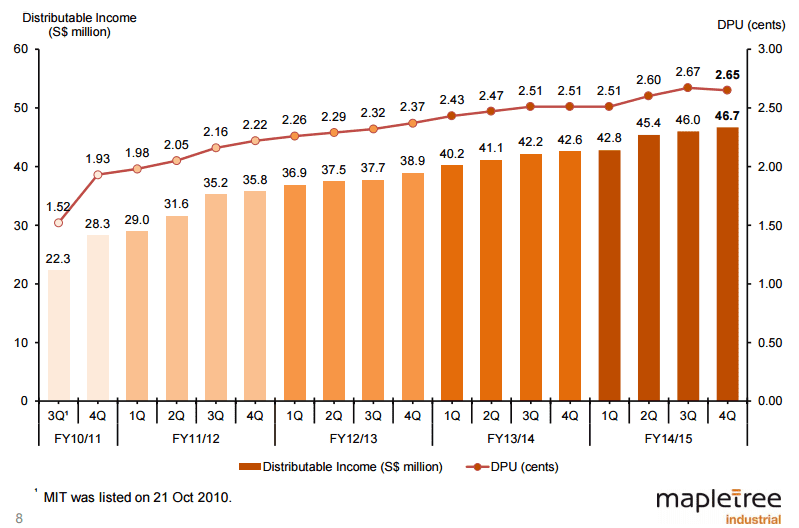
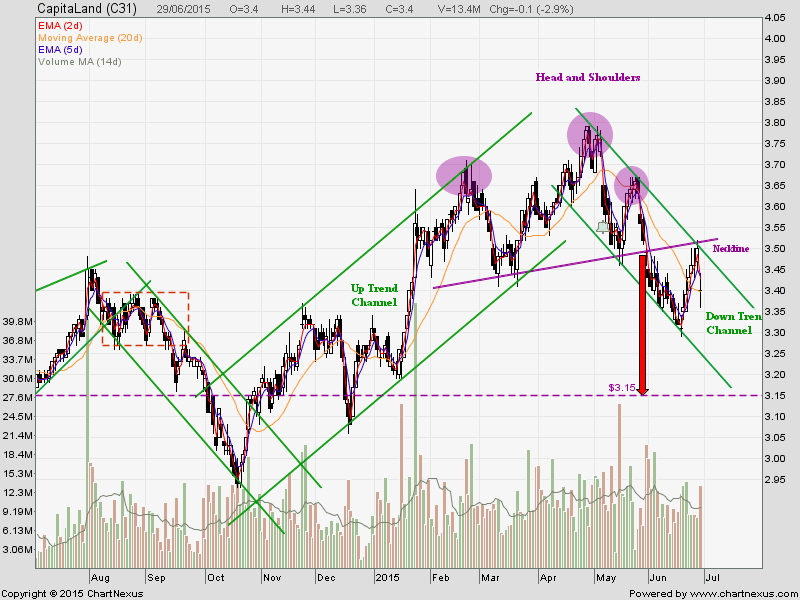
Mapletree Industrial Trust Technical Analysis

Mapletree Ind REIT June30-2015

Mapletree Industrial Trust has rebounded from the 200D SMA support and still maintain a long term up trend. However, investors have to be cautious because a Head and Shoulder (trend reversal) chart pattern is in formation. It is important to watch closely whether Mapletree Industrial Trust can stay above the $1.50-$1.52 support zone.

Check out Singapore REIT Course Detail here to learn how to conduct Trend Analysis & Fundamental Analysis for Singapore REIT.  https://mystocksinvesting.com/course/singapore-reits-investing/

Continue ReadingMapletree Industrial Trust Fundamental and Technical Analysis

Greece Debt Crisis – Worldwide Stock Market Sell off!

  • Post author:

Capture a screen shot to record this worldwide Stock Market Sell due to Greece Debt Crisis.

Get ready to short sell the stock market if this sell off leads to full blown stock market crash! Shorting Time!

Worldwide Sell Off Grexit June 29-2015

Related News:

Greek banks to reopen on Thursday, earlier than originally planned: Official

Greece sets stage for chaotic Monday, week

Greek debt crisis: Analysts on what investors can expect next

Here’s why any Greek debt deal will amount to nothing

Greek referendum: A ‘no’ vote means no to Europe, Juncker says

European markets fall sharply as Greek crisis worsens

Capital controls: How Greeks and tourists will be hit

Continue ReadingGreece Debt Crisis – Worldwide Stock Market Sell off!

Capitaland: Rejected at the Neckline Resistance

  • Post author:

Capitaland is rejected at the Neckline Resistance at about $3.50. This level is also the Down Trend Channel resistance. Capitaland has been trading nicely within the uptrend and down trend channel previously. Feel free to check out the past chart patterns for Capitaland. Base on current bearish chart, short selling Capitaland provides a better Reward Risk Ratio trading strategy,

2015June29-Capitaland-800x600

See previous stock chart analysis for Capitaland.

Continue ReadingCapitaland: Rejected at the Neckline Resistance