Singapore REIT Fundamental Analysis Comparison Table – 3 April 2015

  • Post author:

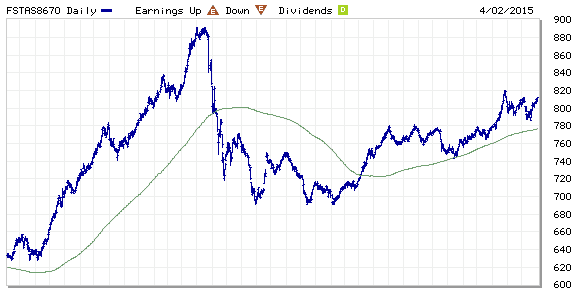
FTSE ST Real Estate Investment Trusts (FTSE ST REIT) Index increases from 805.26  to 812.05 compare to last post on Singapore REIT Fundamental Comparison Table on Mar 1, 2015. The index is continuing the uptrend after retraced to test 790-795 as support. Long term trend for Singapore REIT is bullish base on the chart pattern of this ST REIT index as the 200D SMA is trending up. Immediate resistance at about 820.

FTSE ST REIT Index April3-2015

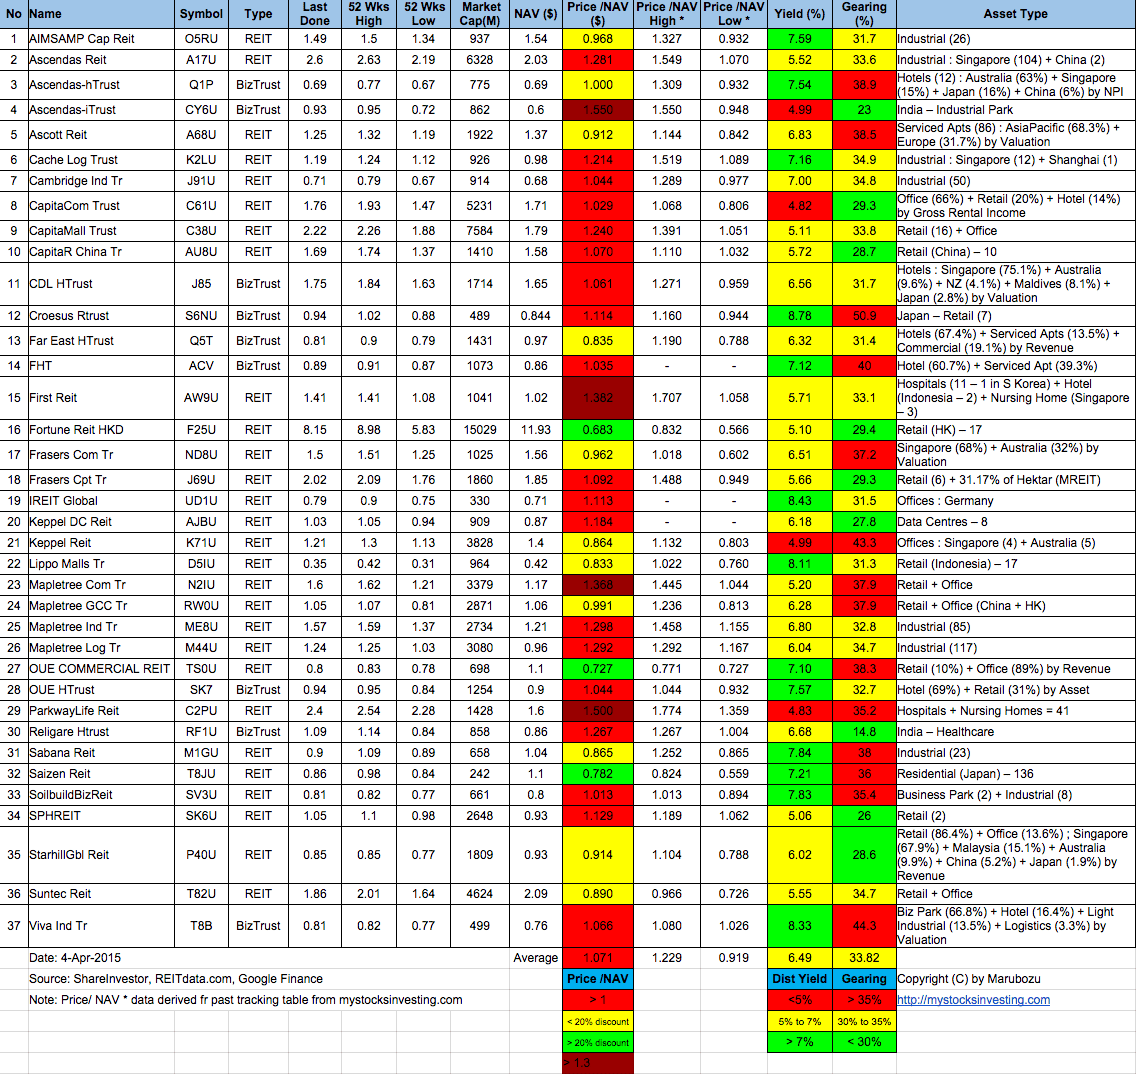
  • Price/NAV no change at 1.07  (Singapore REIT in general slightly overvalue)
  • Distribution Yield increases from 6.48% to 6.49%.
  • Gearing Ratio no change at 33.82%.

Singapore REIT Bubble Charts – Value Selection and Risk Prevention.

Singapore-REIT-Fundamental-Analysis-and-Comparison-Table-4-Apr-2015Singapore Interest Rate April3-2015
SIBOR April3-2015

  • Singapore Interest Rate spikes to 0.39% and retrace back to 0.34%.
  • 1 month increases from 0.61669% to 0.88116% (42% increase!)
  • 3 month increases from 0.68138% to 1.01959% (49% increase!)
  • 6 month increases from 0.74182% to 1.07680% (45% increase!)
  • 12 month increases from 0.87509% to 1.16689% (33% increase!)

Singapore Interest Rate and SIBOR continue to rise. Not a good sign for REIT which have high gearing ratio because there may be increase in borrowing cost depends on the debt expiry profile. Besides REIT, It is also time to seriously evaluate your current mortgage loan and work on Refinance Plan before the mortgage loan interest shot up even further.

Grab an insight of the REIT class here 3 Tips To Increasing Returns On REITs Investments

Check out the very pragmatic and educational public seminar here “Investing in Singapore REIT“.

Continue ReadingSingapore REIT Fundamental Analysis Comparison Table – 3 April 2015

Global Logistic Properties (GLP): Trading in a Channel

  • Post author:

Global Logistic Properties (GLP) is currently trading in a channel. Looks like GLP is facing a channel resistance and 200D SMA. A potential high Risk vs Reward trade on this chart pattern.

2015April1-GLOBAL LOGISTIC PROP LIMITED-800x600

Current P/E Ratio (ttm) 18.3574
Estimated P/E(03/2015) 31.9298
Relative P/E vs. FSSTI 1.3247
Earnings Per Share (USD) (ttm) 0.1061
Est. EPS (USD) (03/2015) 0.0610
Est. PEG Ratio 3.4915
Market Cap (M SGD) 12,874.15
Shares Outstanding (M) 4,839.91
30 Day Average Volume 13,060,400
Price/Book (mrq) 1.0694
Price/Sale (ttm) 13.5376
Dividend Indicated Gross Yield 1.69%
Cash Dividend (SGD) 0.0450
Dividend Ex-Date 07/22/2014
5 Year Dividend Growth
Next Earnings Announcement 05/22/2015
Continue ReadingGlobal Logistic Properties (GLP): Trading in a Channel

Gold ETF (GLD): Double Bottoms Rebound?

  • Post author:

Original post by Marubozu from My Stocks Investing Journey

GLD is in the process of forming a Double Bottoms after rebounding from the support at about $109-$110 with an Inverted Hammer (with bullish confirmation). GLD is currently facing the previous neckline resistance ($115) of Inverted Head and Shoulders. There are a few more resistances ahead ($117 & $122) to clear to confirm the long term down trend reversal.

GLD Mar 20-2015


See previous analysis of SPDR Gold Shares (GLD) here.

Continue ReadingGold ETF (GLD): Double Bottoms Rebound?