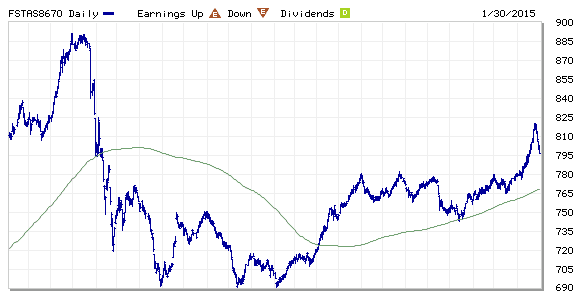
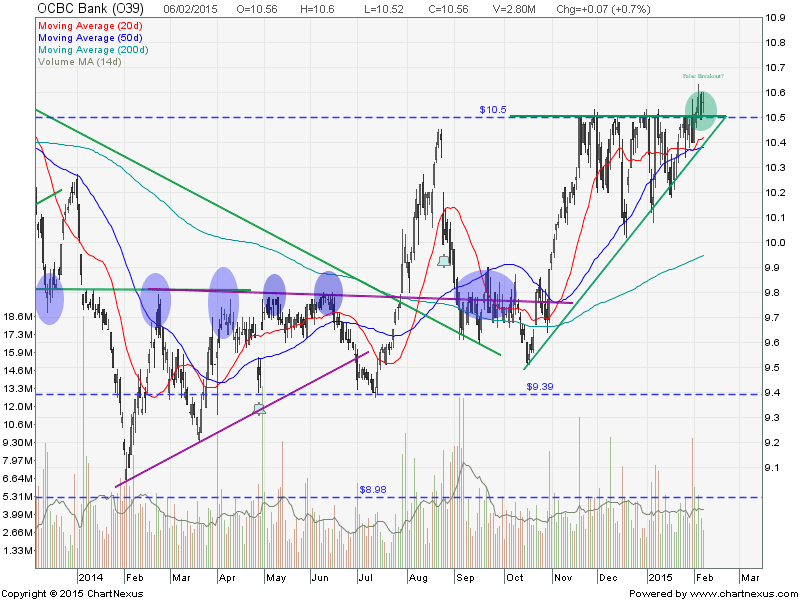
OCBC Bank: False Breakout?
OCBC Bank has broken $10.50 resistance recently. This $10.50 resistance is also the Ascending Triangle resistance. If this is a real breakout, price target for OCBC Bank is about $11.10. Take note that there is no spike in volume to support this breakout. Is this a successful breakout or a false breakout? We will only know the answer after the earning release on Feb 11.
Original post by Marubozu from My Stocks Investing Journey.
| Current P/E Ratio (ttm) | 10.1169 |
|---|---|
| Estimated P/E(12/2014) | 11.1864 |
| Relative P/E vs. FSSTI | 0.6783 |
| Earnings Per Share (SGD) (ttm) | 1.0438 |
| Est. EPS (SGD) (12/2014) | 0.9440 |
| Est. PEG Ratio | 1.1150 |
| Market Cap (M SGD) | 42,065.89 |
| Shares Outstanding (M) | 3,983.51 |
| 30 Day Average Volume | 4,300,717 |
| Price/Book (mrq) | 1.4624 |
| Price/Sale (ttm) | 3.5757 |
| Dividend Indicated Gross Yield | 3.22% |
| Cash Dividend (SGD) | 0.1750 |
| Dividend Ex-Date | 08/25/2014 |
| 5 Year Dividend Growth | 4.56% |
| Next Earnings Announcement | 02/11/2015 |