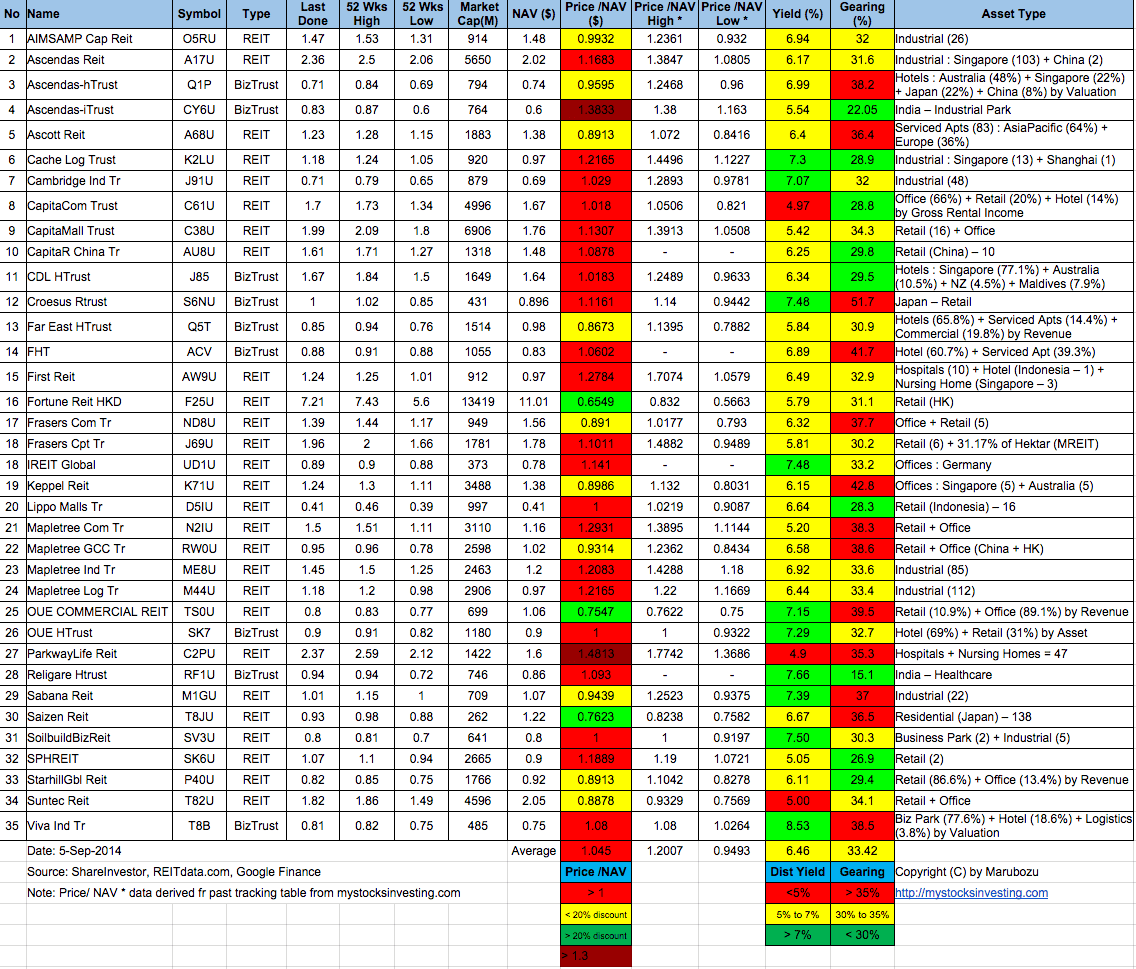
FTSE ST Real Estate Investment Trusts (FTSE ST REIT) Index changes from 764.31 to 775.28 compare to last post on Singapore REIT Fundamental Comparison Table on Aug 7, 2014. The index is trading above 200D SMA and still consolidating within a range between 760 and 780, a Rectangle consolidation pattern. Watch closely these two support and resistances level to see whether there is a change in trend (if 760 support is broken) or continuation of the uptrend (if 780 resistance is broken).

- Price/NAV increases from 1.03 to 1.045 (slightly over value now)
- Dividend Yield decreases from 6.55% to 6.46%.
- Gearing Ratio increases from 33.17% to 33.42%
- IREIT Global traded on the Singapore Stock Exchange on Aug 13, 2014. (Opened $0.88 and closed at $0.895)
- Added IREIT Global.
Singapore Interest Rate

Singapore 3 Months SIBOR

..
Under Watchlist
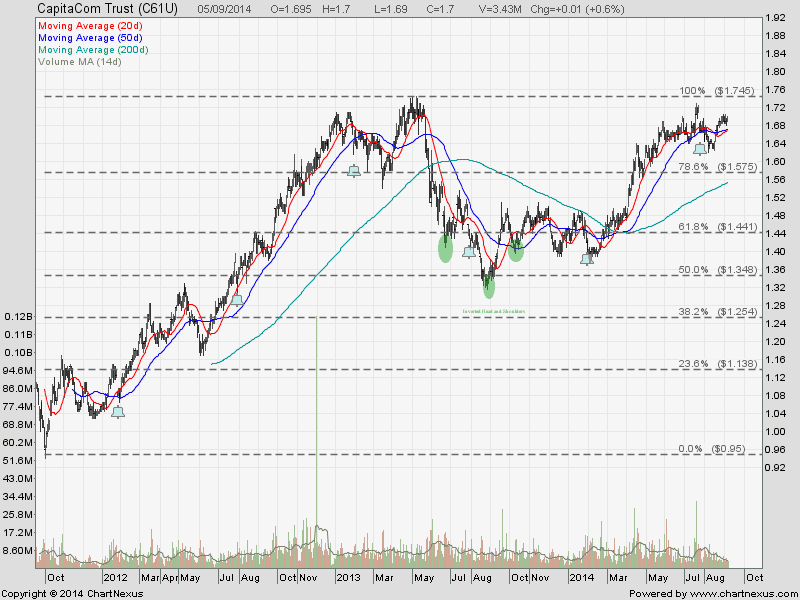
- CapitaCom Trust
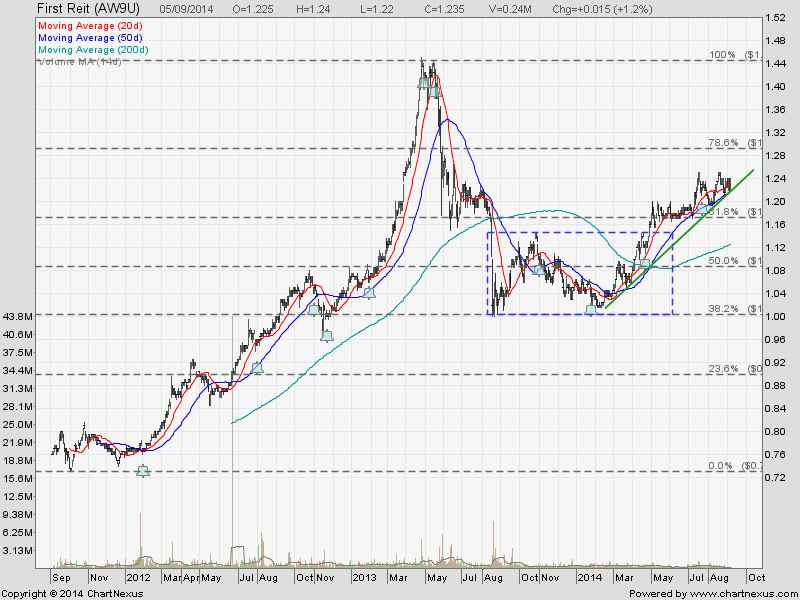
- First REIT
- Fraser Centrepoint Trust
- Fortune REIT
- Lippo Mall Trust
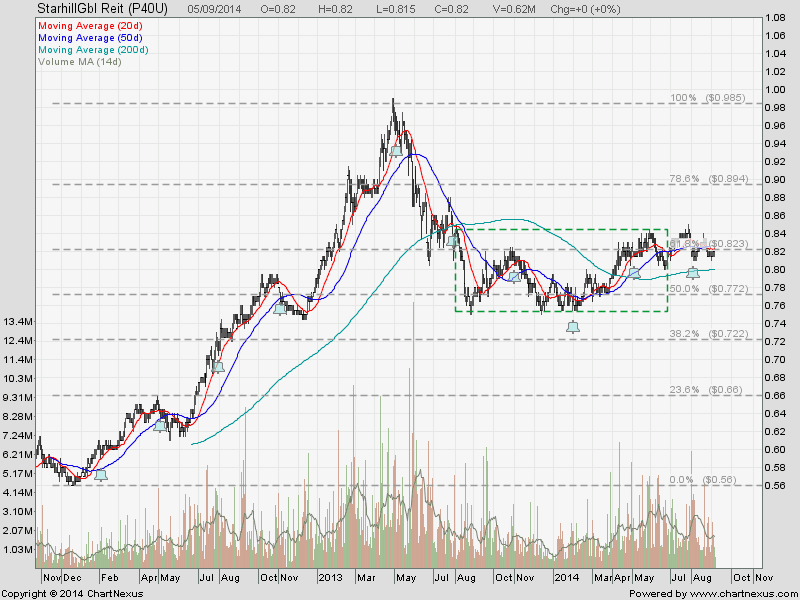
- Starhill Global


One of the key criteria for my watch list is the Gearing Ratio due to my low risk appetite. I do not like to have heart attack because I want my invested capital to be protected and prevent me from suffering a big drop due to right placement. In addition, a sudden hike in interest will have a knee jerk effect on the REIT with high gearing ratio.
If you want to find out how to make use of Gearing Ratio to protect your invested capital, how to invest safely in Singapore REIT to generate passive income, how the interest rate can affect your REIT investment, you can check out the a very pragmatic and educational public seminar here “Investing in Singapore REIT“.
.