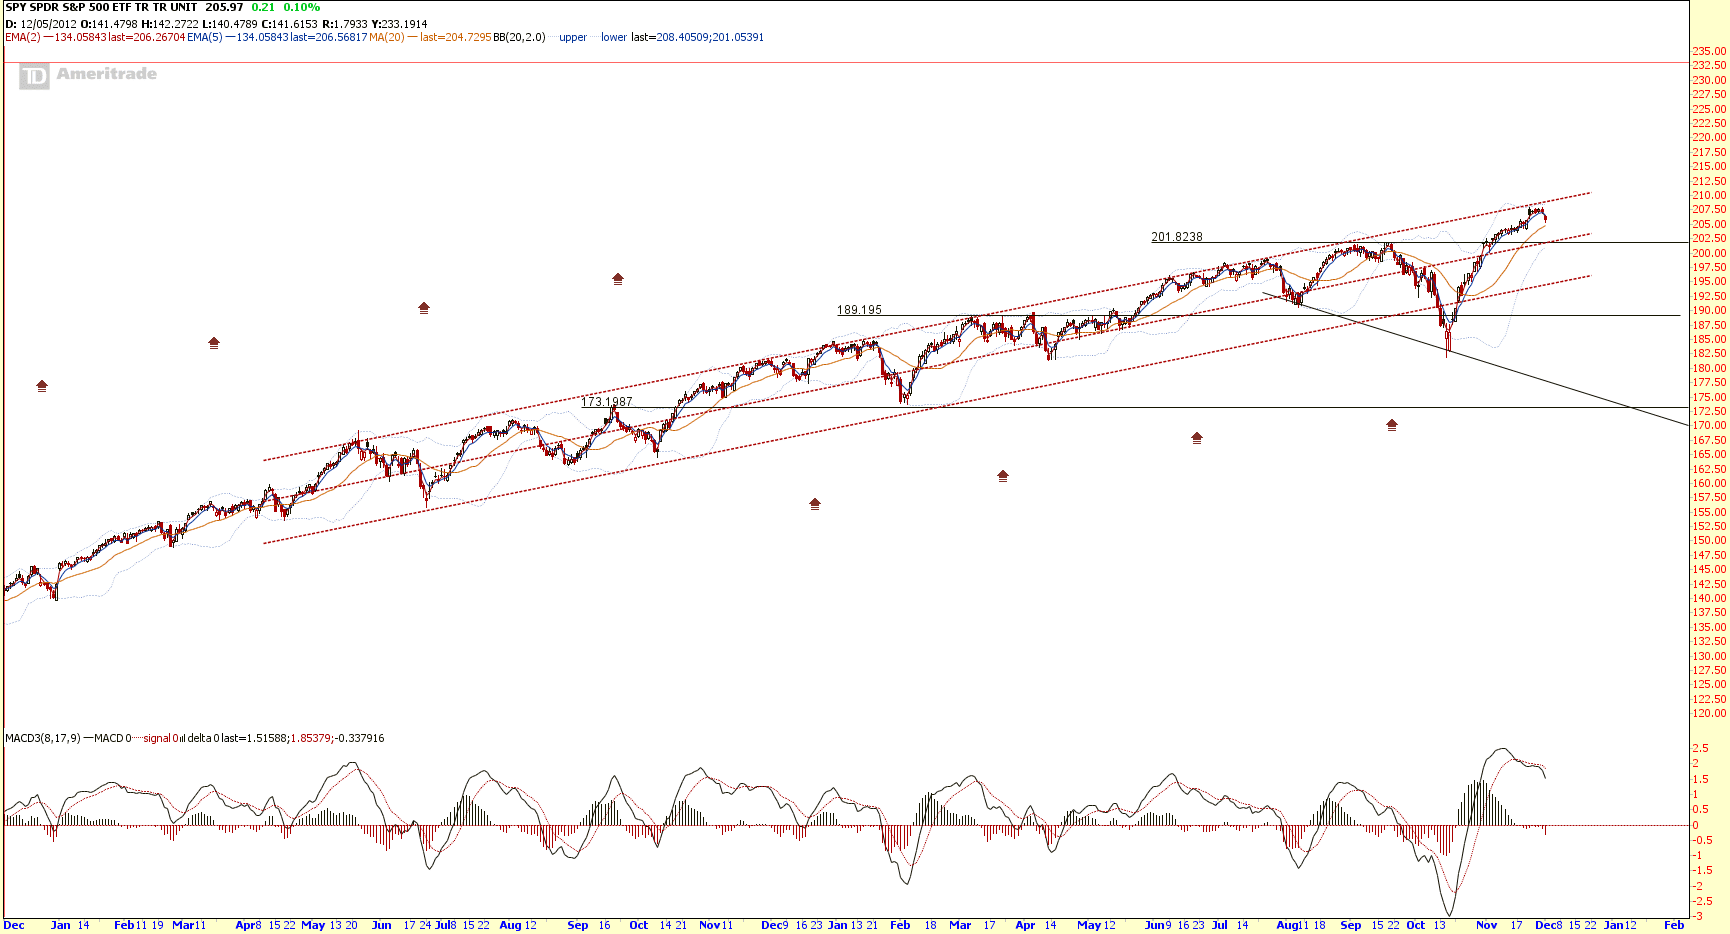
S&P500 ETF (SPY): Expect Correction
S&P500 ETF (SPY) is currently trading within an uptrend channel but expecting to retrace after hitting the channel resistance.
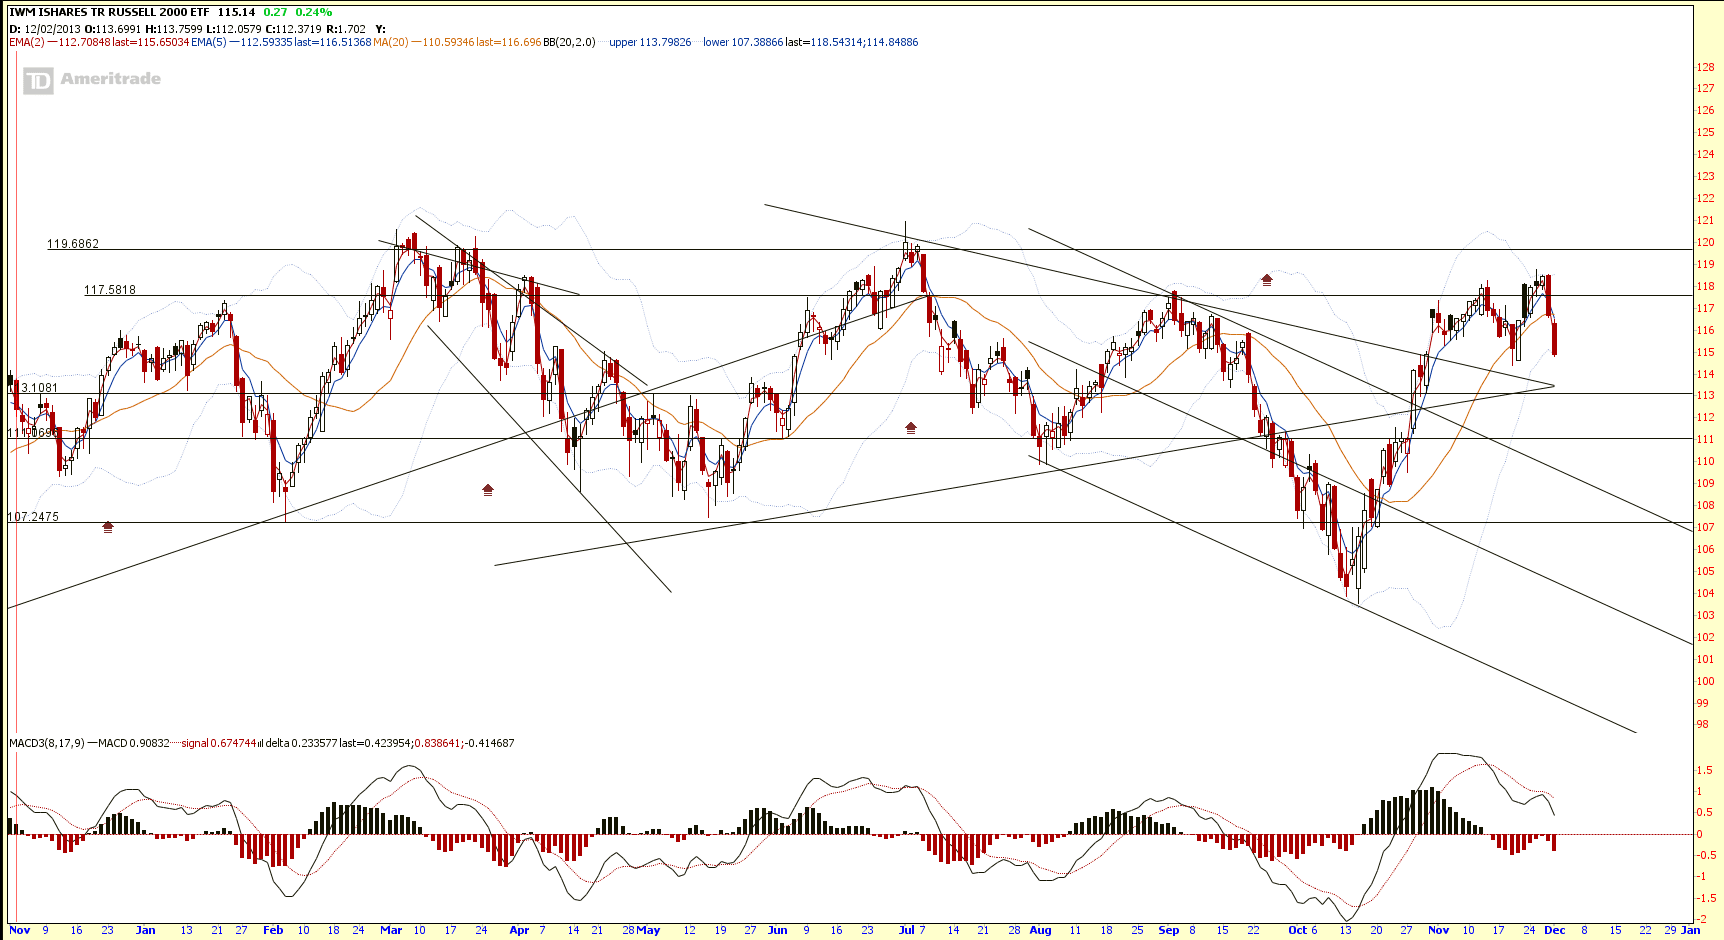
Current PE for Russell 2000 is 18.2 (over value).
Base on past SPY chart pattern, it is not so easy to trade due to the following:
- SPY is at historical high, it is risky to long at high.
- It is also risky to short at the current level because SPY is still on uptrend. It will be a counter trend trade if short at this level.
Original post from My Stocks Investing Journey by Marubozu.