Keppel DC REIT IPO Balloting Result
INDICATIONS OF INTEREST, APPLICATIONS RECEIVED AND ALLOCATIONS
Keppel DC REIT Management Pte. Ltd., as manager of Keppel DC REIT (the “Manager”), is pleased to announce that the indications of interest received for the Placement Tranche and applications received for the Public Offer as at the close of the Offering (as defined in the Prospectus) are as follows:
(a) The Placement Tranche
Indications of interest were received for approximately 5.1 billion Units under the Placement Tranche, resulting in the Placement Tranche being approximately 24.4 times subscribed based on the 207,375,000 Units available under the Placement Tranche.
(b) The Public Offer
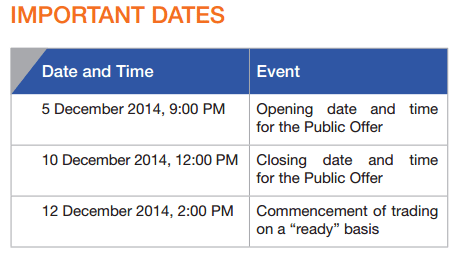
As at the close of the Public Offer at 12.00 noon on 10 December 2014, there were 7,024 valid applications for the 53,763,000 Units available to the public for subscription. In total, these applicants applied for 514,724,000 Units. Based on the aforesaid, the Public Offer was approximately 9.6 times subscribed.
Credit Suisse (Singapore) Limited (the “Stabilising Manager”), on behalf of the Joint Bookrunners and Underwriters, has over-allotted an additional 17,659,000 Units (the “Over-Allotted Units”), all of which were allocated to applicants under the Placement Tranche. Such over-allotment was covered through Units borrowed by the Stabilising Manager from Keppel DC Investment Holdings Pte. Ltd., a wholly-owned subsidiary of Keppel Telecommunications & Transportation Ltd, pursuant to a unit lending agreement between the Stabilising Manager and Keppel DC Investment Holdings Pte. Ltd.. The Stabilising Manager will return an equivalent number of Units to Keppel DC Investment Holdings Pte. Ltd. either through the purchase of Units in the open market by undertaking stabilising actions or through the exercise of the Over Allotment Option, save that such obligation shall be deemed to be discharged to the extent of the number of Units that have been purchased by the Joint Bookrunners and Underwriters pursuant to the exercise of the Over-Allotment Option and the payment of the aggregate offer price in respect of the purchased Units to Keppel DC Investment Holdings Pte. Ltd..

See Keppel DC REIT IPO Prospectus here.
See Keppel DC REIT IPO Balloting and Placement Result announcement here.