iPhone 6 Launch Impact on Apple (AAPL) Stock Price
iPhone6 Impact on AAPL.
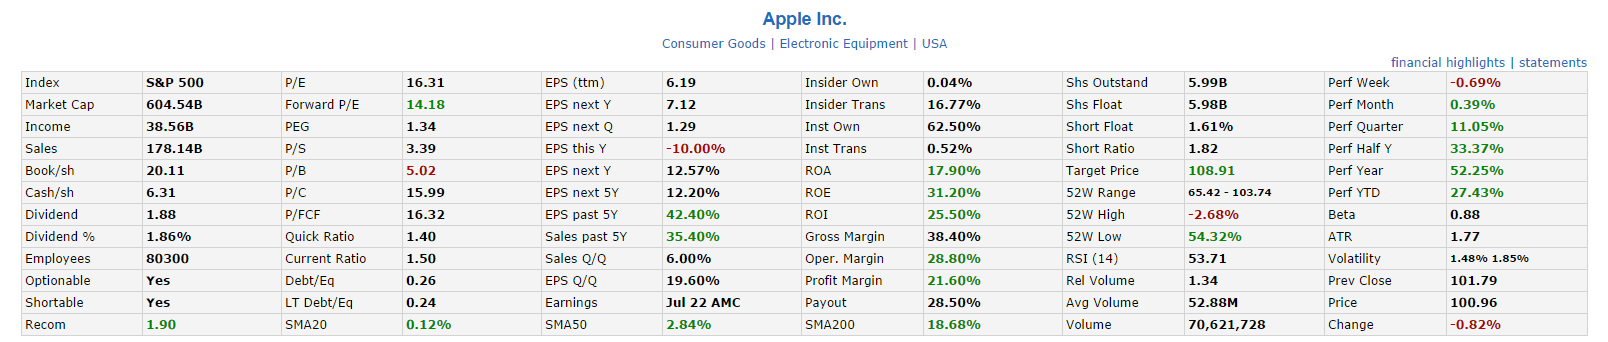
Technically AAPL chart is trading within an uptrend channel. All 3 moving averages are still trending up.

Fundamentally AAPL is still solid with forward PE only 14.18.
AAPL Intrinsic Value
- Operating Cash Flow = $56,371 Million
- No of Shares outstanding = 6 Billion
- Beta = 0.87
- Discount Rate = 6%
- No Growth (0% for next 10 years), IV = $69.15
- Conservative Growth (5% for next 10 years), IV = $89.21
- Moderate Growth (10% for next 10 years), IV = $115.83
- Aggressive Growth Rate (15% for next 10 years). IV = $151.14
Last AAPL intrinsic value calculation using DCF method.
Fundamentally & Technically AAPL looks attractive with current price level.
Check out the Fundamental Analysis Class here if you want to understand how to analyse those Financial Ratio & calculate Intrinsic Value to determine whether the stock is good for investing, learn how to identify whether the stock is on uptrend, and more importantly, where to find important and free information from the internet to do your own research.