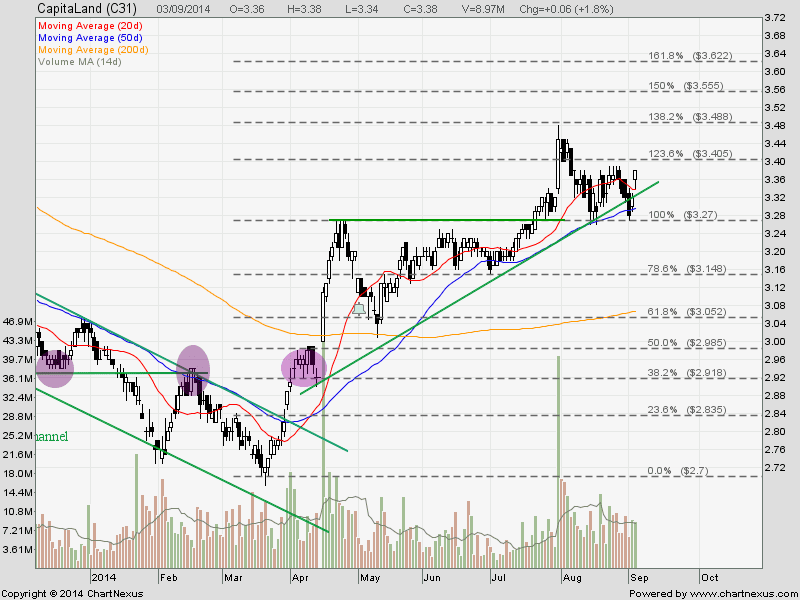
Capitaland: Rebound from 50D SMA Support
Capitaland rebounded from 50D SMA Support with Three Inside Up reversal candlestick pattern. Up trend still intact and price target of 161.8% FR is still valid.
See previous post of Capitaland.

Capitaland rebounded from 50D SMA Support with Three Inside Up reversal candlestick pattern. Up trend still intact and price target of 161.8% FR is still valid.
See previous post of Capitaland.
Market Indices PE Ratio for Major Stock Exchange globally.
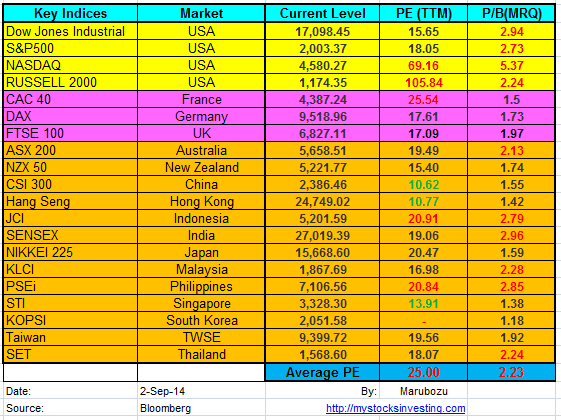
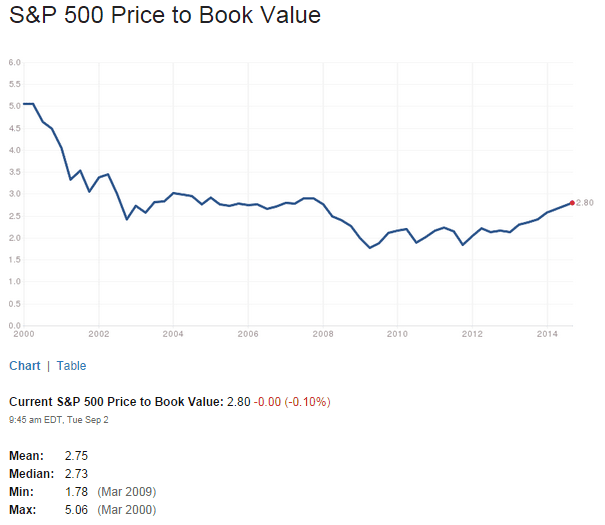
Average PE ratio decreases from 22.91 to 25. All three indices Dow Jones Industrial, S&P500 and NASDAQ are hitting RECORD HIGH! P/B Ratio increase from 2.18 to 2.23. RED ALERT for NASDAQ with PE of 69.16 and RUSSELL 2000 of 105.84!
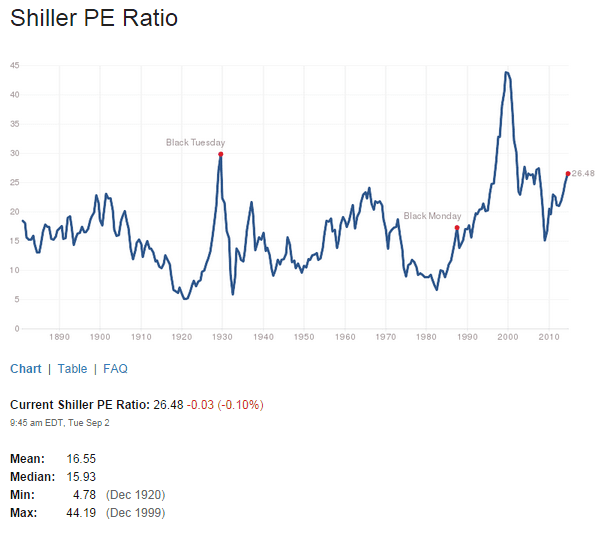
Tons of Warning Sign base on Technical and Valuation.
See Aug 2014 Global Stock Market PE Ratio here.
Technical Analysis:
Rejected at 200D SMA with bearish engulfing candlestick reversal pattern. Expect to move in bearish direction to the next support of $120. Medium term range bound between $120 and $130.

Fundamental Analysis:
 Trade Setup
Original Post by Marubozu My Stocks Investing Journey