Singapore REIT Fundamental Analysis Comparison Table – 8 June 2014
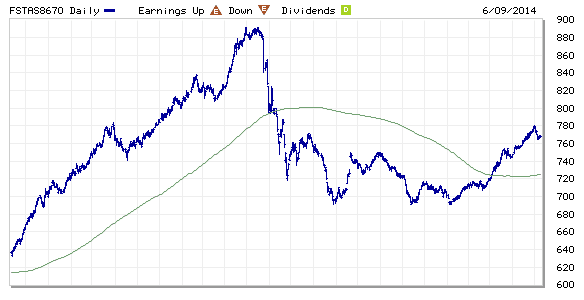
FTSE ST Real Estate Investment Trusts (FTSE ST REIT) Index changes from 755.37 to 768.55 compare to last post on Singapore REIT Fundamental Comparison Table on May 9, 2014. The index is trading above 20D/ 50D/ 200D SMA with 20D/50D SMA trending up. This is an official uptrend for Singapore REITs.
..
- Price/NAV increases from 1.0022 to 1.0229
- Dividend Yield decreases from 6.61% to 6.51%.
- Gearing Ratio decreases from 33.76% to 32.94%
- Added: Realigare HTrust.
- Added two columns (Price/NAV High & Low). To my REIT workshop participant, I have uploaded the excel spreadsheet to the Facebook closed group.
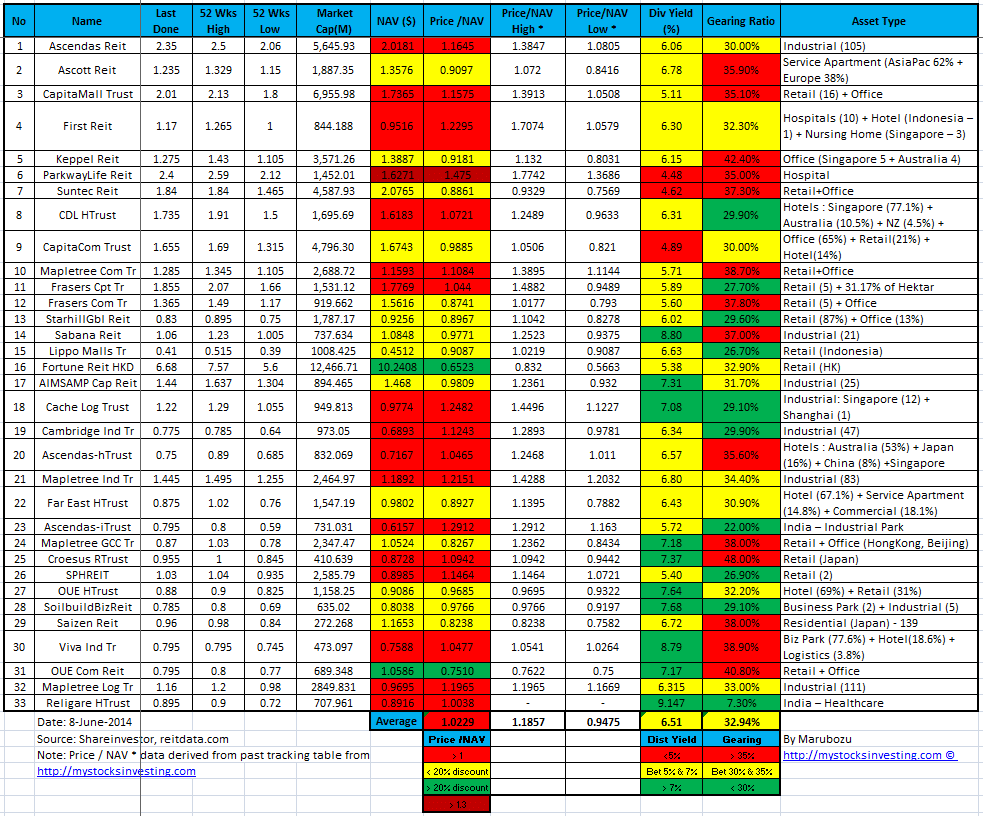
- In general (base on quantitative analysis and technical analysis), Singapore REIT is at fair value now and the distribution yield is attractive (but with risks). A number of REITs have started a confirmed uptrend base on trend analysis (using Technical Analysis). Buy on Dip can be a good accumulation strategy here for fundamentally strong REIT (well managed WADM & WALE, Diversified Tenant Mix, currency risk, AEI and acquisition to increase DPU, currency hedging).
- Be extremely careful with those REITs with High Yield. High Yield does NOT mean that it is a good REIT to invest. Religare HTrust offers 9.1% yield but the risk is very high with super low gearing at 7.3%. It looks very attractive just purely base on the numbers but we still have to do the risk assessment in detail. I have posted my personal view and Risk Assessment in my Facebook Closed Group for my students. Ex-students who wish to join the facebook page please drop me an email marubozu@mystocksinvesting.com. State your name and your course date so that I can add you into the page.
- Find out in the next workshop on “How to pick Singapore REIT for Dividend Investing” to learn how to do Quantitative, Qualitative Analysis and Risk Assessment Plus Identify the Trend on Singapore REITs to apply this accumulation strategy for Singapore REIT.