ST Engineering: Respect the 50D SMA
ST Engineering is currently trading in down trend and in short term consolidation. More down side expected in the coming days or weeks as ST Engineering was rejected at $3.83 support turned resistance (green) and also the 50D SMA resistance (blue). 50D SMA is rather reliable as support & resistance for ST Engineering when the stock is trending. The price target of the Symmetrical Triangle breakout is still valid. See previous stock chart analysis for ST Engineering here.
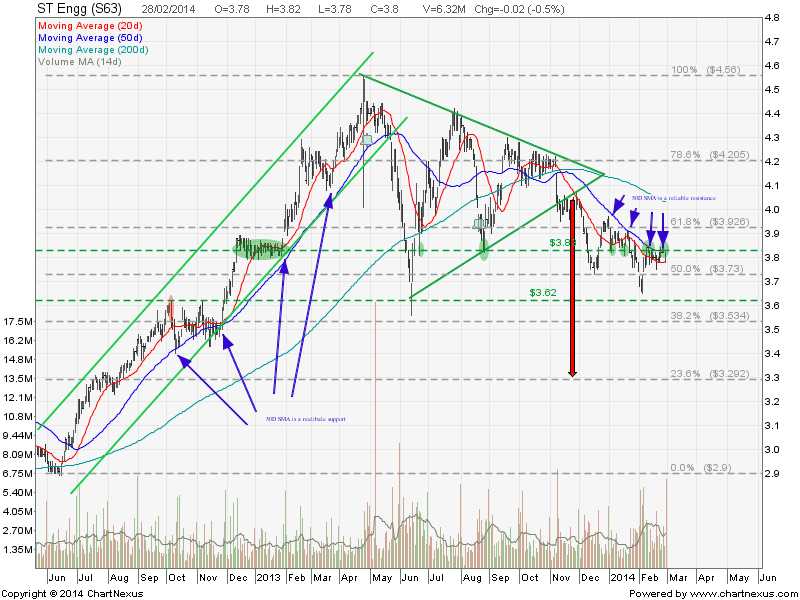
Join the Technical Analysis Workshop to learn how to derive the target price of the chart pattern of Symmetrical Triangle and learn how to identify a reliable support & resistance level to increase the probability of winning in your trade.