Is Stock Market a Pasar Malam?
I receive many questions whether this is the right time to buy stocks. I also saw many investors to tell others to buy this stock or buy that stock when the price has dropped significantly….
Original post by Marubozu from My Stocks Investing Journey.
There is no right or wrong answer because it very much depend on individual risk appetite and risk tolerance (ie. holding power).
My humble thoughts:
- Stock Market is not a Pasar Malam, it does not mean we must buy when the stock price has dropped significant or cheap (or Perceived Cheap). Cheap stock can get cheaper! Low Stock Price does not mean the Stock is cheap.
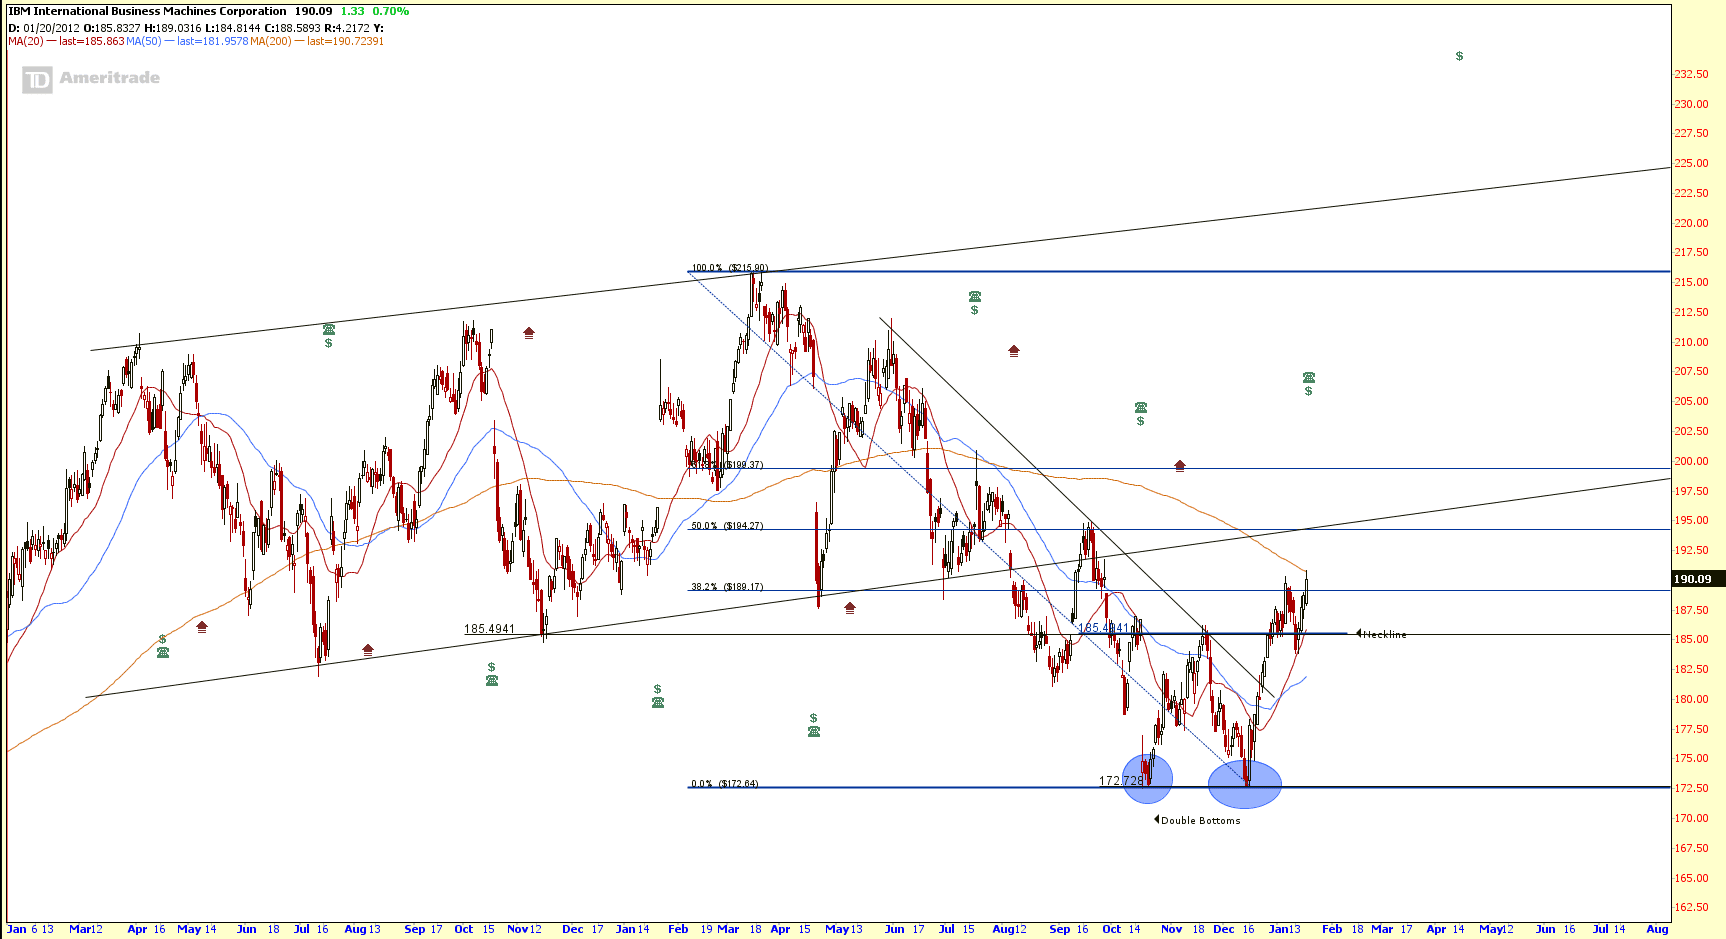
- When the chart is showing a confirmed Down Trend, why do we need to be so hurry to buy and lose more money?
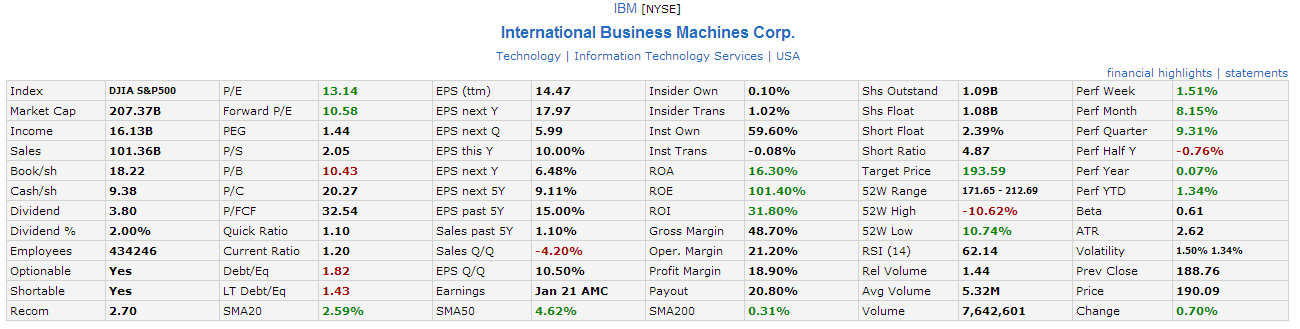
- Some property counters are trading below the NAV (ie. under value) but undervalue stock can become more undervalue if it is on the down trend. Do you know that NAV can drop when interest rate increases?
- Some REITs are offering attractive dividend, do you know what your Total Invested Capital can lose more than 10% within a month (on down trend) while you are chasing for a Annual Dividend Yield of 6-7%?
- Do not Live in Denial. Down Trend is Down Trend (This is Fact and can be seen on the chart). The stock price will go lower in the down trend. No point to “selectively” search for “make yourself feel good” factors to stay in the trade (This is Hope). I have seen many investors to find all the good reasons to justify themselves to hold on the losing trades and “hope” the stock will come back one day. There must be some reasons why the stock price plunge and beaten down badly. What make them feel that their analysis is always right? Trade base on what we see but not what we hope.
- Do not fall in love with certain stocks. Stock is NOT your girl friend / boy friend or wife / husband, and you don’t need to have love affair with the stocks. The objective of Investing in stock is to make Money $$. You don’t need to be faithful to the stocks which can’t make you money. Dump the stocks and move to seek for another Good Stock (to long) or Bad Stock (to short.)
To cut the long story short, it is NO WAY we as retail investors (even professional traders and economists) to know everything about the stock market. My approach is ALWAYS refer to the chart when in doubt. Those stock price in the chart will tell the whole story. I will not invest in any stock when there is a down trend no matter how attractive is the valuation or good news (which can be manipulated).