Wilmar: Start of An Up Trend
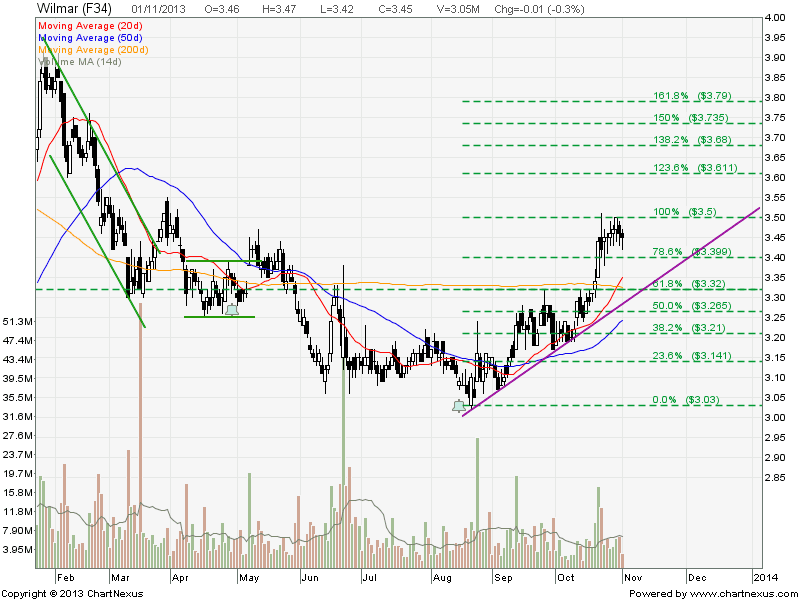
Wilmar looks like starting an uptrend after breaking the 200D SMA resistance. Target to enter when Wilmar completes the retracement back to 61.8% Fibonacci Level at about $3.32. This level is also the 200D SMA and uptrend support (purple line). Wait for the retest to complete with a reversal candlestick pattern at this support.
Key Statistics for WIL
| Current P/E Ratio (ttm) | 12.5686 |
|---|---|
| Estimated P/E(12/2013) | 13.6836 |
| Relative P/E vs. FSSTI | 0.9150 |
| Earnings Per Share (USD) (ttm) | 0.2210 |
| Est. EPS (USD) (12/2013) | 0.2030 |
| Est. PEG Ratio | 1.3415 |
| Market Cap (M SGD) | 22,072.40 |
| Shares Outstanding (M) | 6,397.80 |
| 30 Day Average Volume | 5,968,026 |
| Price/Book (mrq) | 1.2230 |
| Price/Sale (ttm) | 0.3983 |
| Dividend Indicated Gross Yield | 1.59% |
| Cash Dividend (SGD) | 0.0250 |
| Dividend Ex-Date | 08/16/2013 |
| 5 Year Dividend Growth | 16.17% |
| Next Earnings Announcement | 11/07/2013 |
Original Post by Marubozu @ My Stocks Investing Journey.