
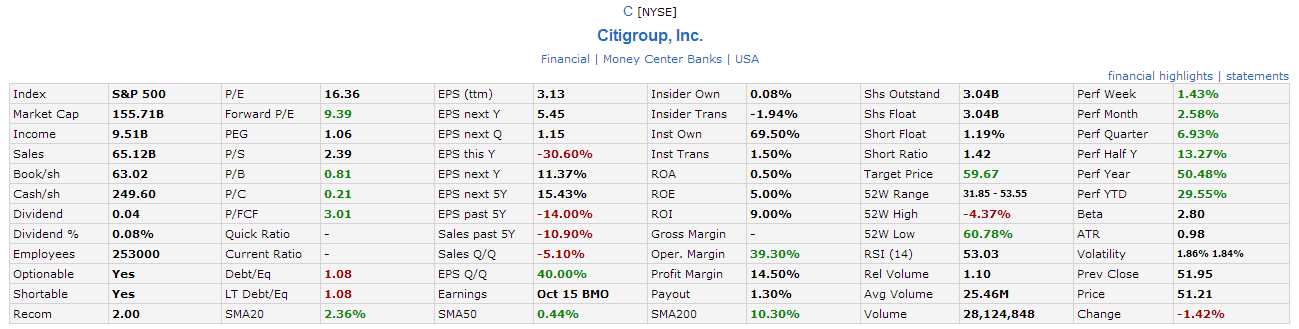
Citigroup (C): Triple Tops in formation
Citigroup is forming A Triple Tops and Ascending Triangle.
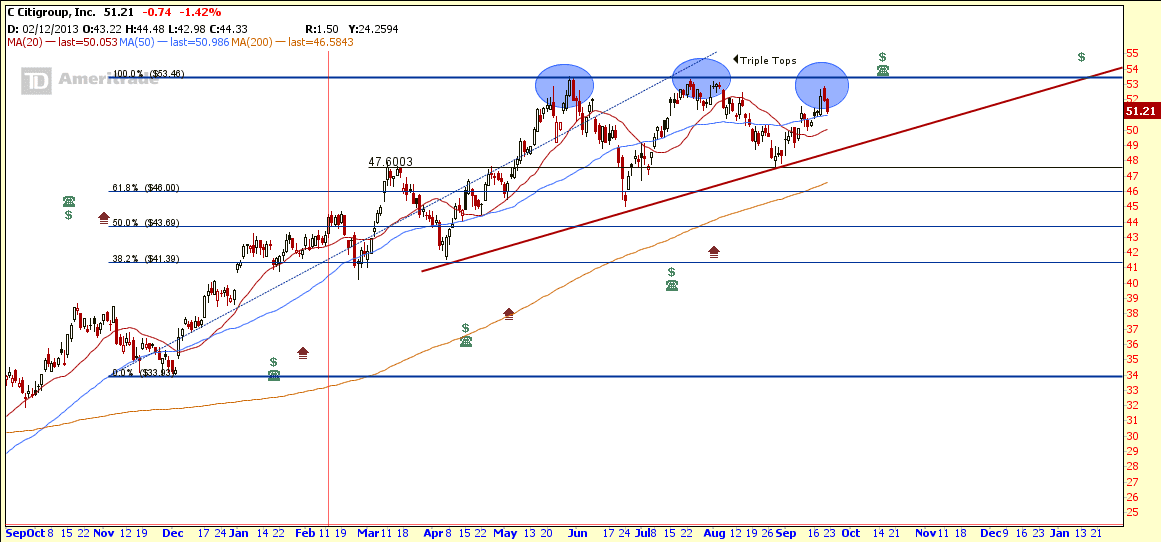
Chart from thinkorswim, open an account to get FREE chart here. Original post by Marubozu.
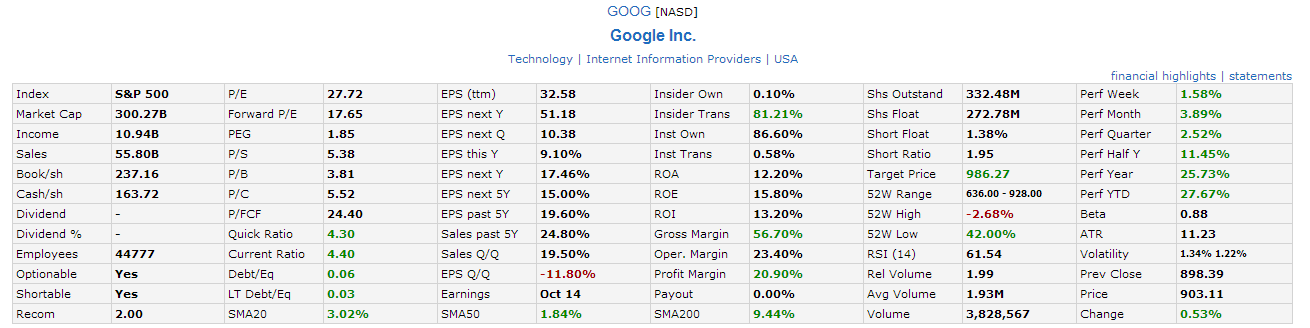
Google (GOOG): Triple Tops In Formation
Google (GOOG) is currently trading in a rectangle range between $843 and $925. At the same time, a Triple Tops reversal chart pattern is in formation. Watch out for the next movement after the earning release on Oct 14.
Chart from thinkorswim, open an account to get FREE chart here. Original post by Marubozu

- Go to the previous page
- 1
- …
- 329
- 330
- 331
- 332
- 333
- 334
- 335
- …
- 656
- Go to the next page