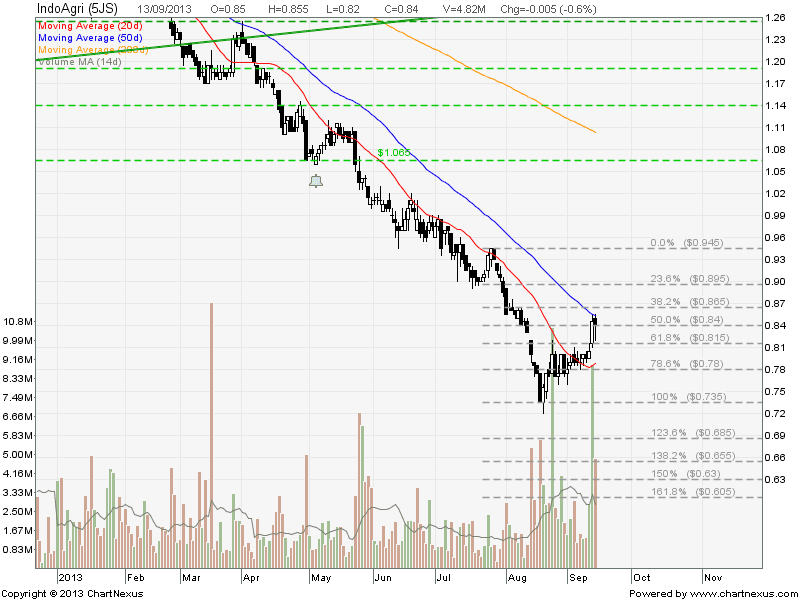
Singapore REIT Fundamental Analysis Comparison Table – 6 Sept 2013

  • Post author:

FTSE ST Real Estate Investment Trusts (FTSE ST REIT) Index changes from 749.17 to 699.17 compare to last post on Singapore REIT Fundamental Comparison Table on Aug 9, 2013. The index is trading below 200D SMA and technically bearish. Currently the index is trading in Elliott Wave C (down) and no sign of reversal yet.

 FTSE ST REIT Index Sept6-2013

Compare to last Singapore REIT comparison table:

Added Soilbuild Business REIT.

  • Price/NAV decreases from 1.0568 to 0.9763.
  • Dividend Yield increases from 5.91% to 6.41%.
  • Gearing Ratio remains the more or less the same at 33.07%.
  • In Short, Singapore REIT become attractive in terms of valuation and distribution yield again. However technically Singapore REIT is still on down trend and the price can go even lower although fundamental looks attractive.

Singapore REIT NAV Gearing Distribution Yield Comparison Table 6-Sept-2013


Find out how I do research on Singapore REIT, how to interpret those financial ratio in the comparison table, when is the best time to buy using simple Trend Analysis. Check out my next public tutorial on  “How to pick Singapore REIT for Dividend Investing” .


Continue ReadingSingapore REIT Fundamental Analysis Comparison Table – 6 Sept 2013

OCBC Bank: Consolidating in a Symmetrical Triangle

  • Post author:

OCBC Bank is currently consolidating in a Symmetrical Triangle and trading just above the Triangle Support. Expect rebound at current level to the Triangle resistance at about $10.50-$10.60.

Original post by Marubozu https://mystocksinvesting.com

2013Sept3-OCBC Bk-800x600

Key Statistics for OCBC

Current P/E Ratio (ttm) 9.3389
Estimated P/E(12/2013) 13.1455
Relative P/E vs. FSSTI 0.7431
Earnings Per Share (SGD) (ttm) 1.0740
Est. EPS (SGD) (12/2013) 0.7630
Est. PEG Ratio 2.4196
Market Cap (M SGD) 34,437.33
Shares Outstanding (M) 3,433.43
30 Day Average Volume 4,124,400
Price/Book (mrq) 1.4845
Price/Sale (ttm) 4.1289
Dividend Indicated Gross Yield 3.39%
Cash Dividend (SGD) 0.1700
Last Dividend 08/12/2013
5 Year Dividend Growth 3.96%
Next Earnings Announcement 11/08/2013
Continue ReadingOCBC Bank: Consolidating in a Symmetrical Triangle