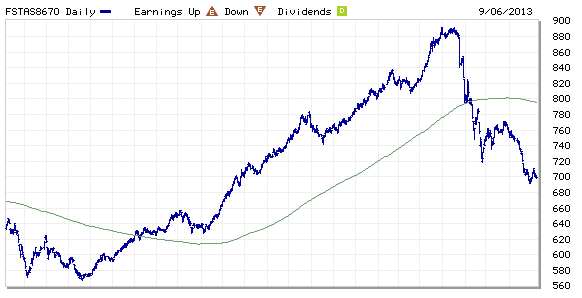
Genting Singapore: Range Bound for Now BUT…..
Genting Singapore is currently trading in a Rectangle Range between $1.40 and $1.32. However, technically Genting Singapore is in a bearish region where the stock price is currently trading below 20D, 50D and 200D SMA. Base on current chart pattern, upside is very limited as there are many strong resistances at $1.35 (20D/50D SMA), $1.40 (Rectangle Resistance) and $1.42 (200D SMA). Watch out for the Rectangle breakout with next support at $1.20.
Fundamentally Genting Singapore is over value base on PE ratio and PEG ratio. There is also no catalysts to favor the bull for this stock at the moment.
Original Post by Marubozu https://mystocksinvesting.com

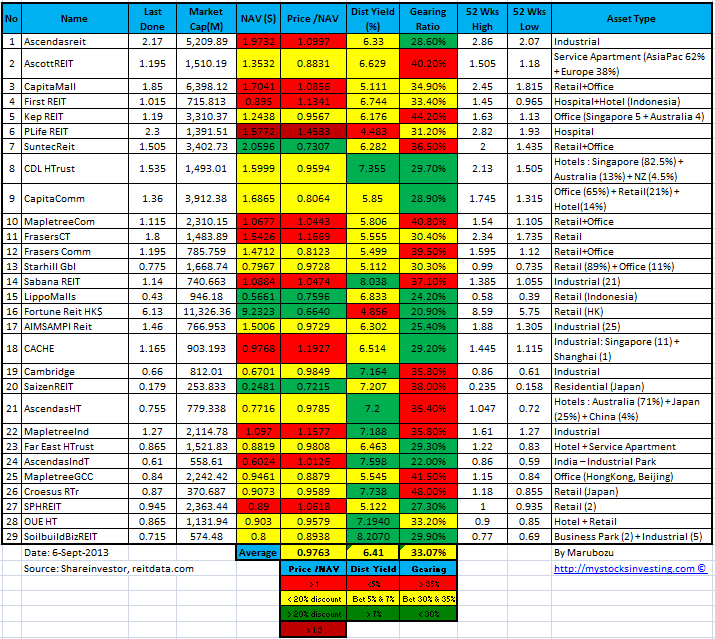
Key Statistics for GENS
| Current P/E Ratio (ttm) | 32.6406 |
|---|---|
| Estimated P/E(12/2013) | 26.1765 |
| Relative P/E vs. FSSTI | 2.6190 |
| Earnings Per Share (SGD) (ttm) | 0.0409 |
| Est. EPS (SGD) (12/2013) | 0.0510 |
| Est. PEG Ratio | 1.9390 |
| Market Cap (M SGD) | 16,321.13 |
| Shares Outstanding (M) | 12,225.56 |
| 30 Day Average Volume | 20,145,130 |
| Price/Book (mrq) | 2.3835 |
| Price/Sale (ttm) | 5.7399 |
| Dividend Indicated Gross Yield | 0.75% |
| Cash Dividend (SGD) | 0.0100 |
| Last Dividend | 05/08/2013 |
| 5 Year Dividend Growth | – |
| Next Earnings Announcement | 11/12/2013 |