Lippo Malls Indo Retail Trust (LMIR) Fundamental & Technical Analysis

  • Post author:

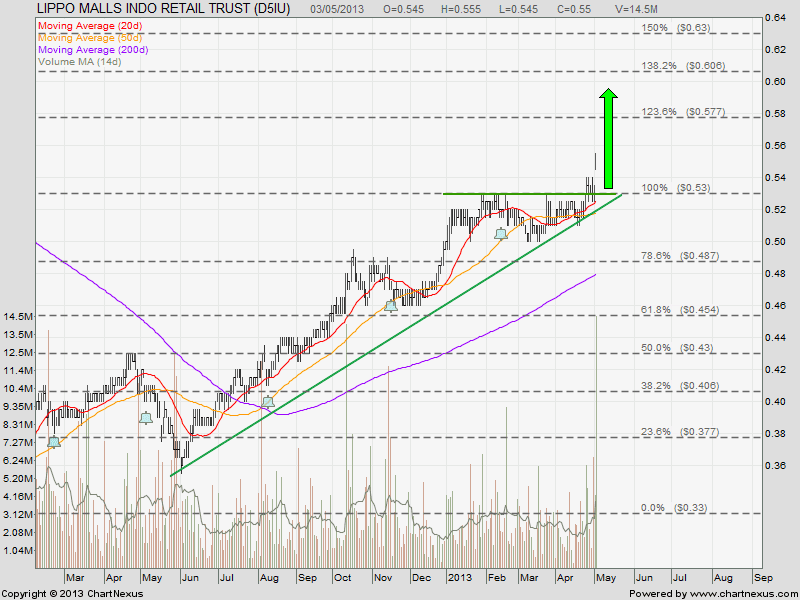
Lippo Malls Indo Retail Trust (LMIR) broke out from Ascending Triangle with huge volumn after reporting 30% increase in DPU compare to the same quarter in the previous year. The price target of this breakout is about $0.60. The stock is currently on clear uptrend and 5% undervalue to NAV of $0.57. Current price is $0.535.

LMIR May3-2013

Fundamental Data (From 1Q, 2013 Earning Result Presentation)

  • NAV = $0.57
  • DPU (1Q, 2012) = 0.63 cents
  • DPU (1Q, 2013) = 0.89 cents (+30%)
  • Distribution Yield (Annualised) = 6.9% (base on $0.515)
  • Gearing Ratio = 24.3%
  • Lease Expiry: More than 70% expire beyond 2015.

Fundamentally LMIR is undervalue and have very good prospect of further increase in DPU base on their growth strategy (S$4 Billion portfolio in 3-5 years) with low gearing ratio. Technically LMIR is on clear uptrend.

See comparison table of other Singapore REIT.

Past analysis on Lippo Mall Indonesia Retail Trust which posted one year ago.


Continue ReadingLippo Malls Indo Retail Trust (LMIR) Fundamental & Technical Analysis

Keppel Corp: Rebound from here?

  • Post author:

Keppel Corp is technically bearish and on down trend after breaking the 200D SMA support. The stock is currently on down trend but will be testing the the Big Rising Wedge support. This support is quite a reliable support which tested past 3 times. Watch this support closely and wait for the reversal candlestick pattern (Inverted Hammer, Hammer, Morning Star, Bullish Engulfing, Three Inside Up, etc) to long. Alternatively, KepCorp will continue to fall if this support is broken with price target of $9.00.

Note: 20D SMA looks like quite a reliable support and resistance.

20013May3-KepCorp-740x480

See past analysis on Keppel Corp.


Continue ReadingKeppel Corp: Rebound from here?

Singapore REITs Comparison Table for Dividend Investment – May 2013

  • Post author:

Marked BUBBLE in black! Amazingly people is willing to overpay > 70% of the value to invest in First REIT and Parkway Life REIT.

Singapore S-REIT stock comparison table 2May-2013

Compare to last month SREIT comparison table:

  • Price/NAV increases from 1.20 to 1.22
  • Dividend Yield drops from 5.34% to 4.97%
  • Gearing Ratio drops from 33.15% to 32.92%

First REIT chart shows Parabolic Curve.

First REIT May2-2013


Parkway REIT is at almost historical high.

Parkway REIT May2-2013


Doing Fundamental Analysis of Singapore REIT is relatively easier than stock. If you are interested to learn how to do research on Singapore REIT and also time the entry / exit by learning the simple Trend Analysis, you may want to check out my 1st public tutorial “How to pick Singapore REIT for Dividend Investing” .


Continue ReadingSingapore REITs Comparison Table for Dividend Investment – May 2013