
Singapore REITs Comparison Table for Dividend Investment – Mar 2013
Added Mapletree Greater China Commercial Trust (MGCCT) in the Singapore REIT comparison Table. Very tempted to subscribe? This means Mapletree Investor Relationship has done a good job in hyping everyone up. Don’t get me wrong, MGCCT is a good REIT but unfortunately it is over value base on NAV and have high gearing. I am giving it a pass because it does not meet my criteria. There is NO Right or Wrong reason when come to investing in REIT, it very much depends on your objective, risk appetite and your own criteria. You still can invest in REIT although it is overvalue because the stock price can go even higher after IPO then you will be the hero. However, it is important to know WHEN to get out if the stock market reverse to the down trend. Most of the time, you are able to see from the stock chart because the chart will tell you to “GET OUT NOW!”
In General, Singapore REIT is OVERVALUE so Invest with Care! Don’t be greedy with that dividend payout because you will lose your invested capital even more when the stock price plunges!
-
Mapletree Launches Fourth REIT: First REIT with Commercial Properties in PR China and Hong Kong – S$1.68 billion1 S-REIT IPO of Mapletree Greater China Commercial Trust (“MGCCT”) set to be Singapore’s largest ever S-REIT IPO
- Mapletree Greater China Commercial Trust (MGCCT) Prospectus
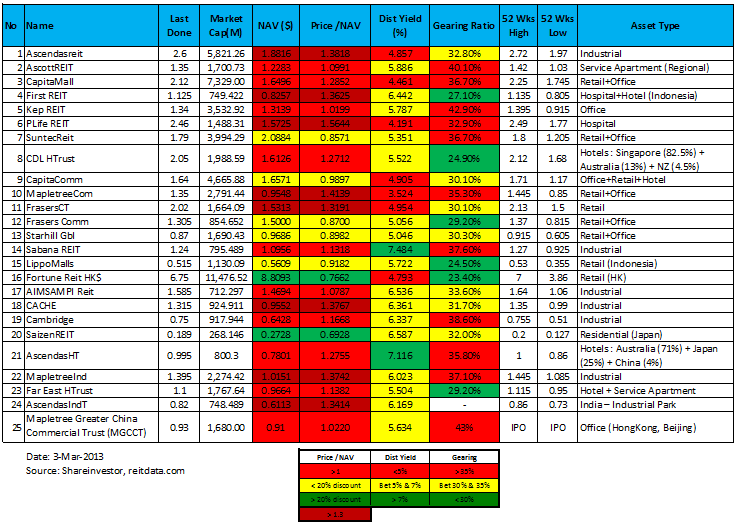
Last comparison table of Singapore REITs. You can compare how the REITs become more and more overvalue for the past 1 year. Most charts are going up in one straight line which is scary.
BTW, actually you can do a quick check on this MGCCT IPO before deciding whether you want to subscribe or not. Just simply check a few financial ratio like NAV, Gearing Ratio, Distribution Yield and compare with other REITs, you should be able to make a decision by yourself instead of asking other people and searching the internet for tips. Sign up my REIT investing class if you find my REIT analysis is easier to understand, pragmatic and practical.

