Money and Me: Winners and losers of latest S-REITs earnings season
Earnings season is once again back in full swing and the REIT sector is first in line to report its financial results. So who are some of the winners and losers of this season’s results?
Find out with Michelle Martin and Kenny Loh, REIT Specialist & Independent Financial Advisor as they break down the details. They also discuss why S-REITs are defying recessionary fears and what 2023 holds for this sector.
Note: The above analysis are my own personal views and are NOT buy or sell recommendations. Investors who would like to leverage my extensive research and years of Singapore REIT investing experience can approach me separately for a REIT Portfolio Consultation.
Listen to his previous market outlook interviews here:
Kenny Loh is an Associate Wealth Advisory Director and REITs Specialist of Singapore’s top Independent Financial Advisor. He helps clients construct diversified portfolios consisting of different asset classes from REITs, Equities, Bonds, ETFs, Unit Trusts, Private Equity, Alternative Investments, Digital Assets and Fixed Maturity Funds to achieve an optimal risk adjusted return. Kenny is also a CERTIFIED FINANCIAL PLANNER, SGX Academy REIT Trainer, Certified IBF Trainer of Associate REIT Investment Advisor (ARIA) and also invited speaker of REITs Symposium and Invest Fair.
Technical Analysis of FTSE ST REIT Index (FSTAS351020)
FTSE ST Real Estate Investment Trusts (FTSE ST REIT Index) increased from 725.07 to 748.41(3.22%)compared to last month’s update. The S-REIT Index is currently retracing back to the resistance turned support level at about 740, after failing to break above the previous support turn resistance zone of 790-800.
Short-term direction: Down (retracement is underway)
Medium-term direction: Up (50D SMA is sloping upward)
Long-term direction Down (200D SMA is sloping down)
The following is the compilation of 38 Singapore REITs with colour-coding of the Distribution Yield, Gearing Ratio and Price to NAV Ratio.
The Financial Ratios are based on past data and these are lagging indicators.
This REIT table takes into account the dividend cuts due to the COVID-19 outbreak. Yield is calculated trailing twelve months (ttm), therefore REITs with delayed payouts might have lower displayed yields, thus yield displayed might be lower for more affected REITs.
REITs highlighted inyellow-green are now updated with the latest Q4 2022 business updates/earnings.
REITs highlighted in yellow-orangeare still using Q3 2022 results.
SPH Reit has been renamed to Paragon REIT since January 3rd, 2023.
FY DPU: If Green, FY DPU for the recent 4 Quarters is higher than that of the preceding 4 Quarters.If Lower, it isRed.
Yield (ttm): Yield, calculated by DPU (trailing twelve months) and Current Price as of February 10th 2023.
Daiwa House Logistics Trust: Yield calculated from trailing six months distribution, TTM yield is annualised.
Gearing (%): Leverage Ratio.
Price/NAV: Price to Book Value. Formula: Current Price over Net Asset Value per Unit.
Yield Spread (%): REIT yield (ttm) reference to Gov Bond Yields. REITs trading in USD is referenced to US Gov Bond Yield, everything else is referenced to SG Gov Bond Yield.
Price/NAV Ratios Overview
Price/NAV increased to 0.85.
Increased from 0.80 in January 2023.
There has been a recent sell-off in September-October period.
Singapore Overall REIT sector is undervalued now.
Take note that NAV is adjusted upwards for some REITs due to pandemic recovery.
Most overvalued REITs (based on Price/NAV)
Parkway Life REIT (Price/NAV = 1.75)
Keppel DC REIT (Price/NAV = 1.43)
Mapletree Industrial Trust (Price/NAV = 1.22)
Mapletree Logistics Trust (Price/NAV = 1.19)
Capitaland Ascendas REIT (Price/NAV = 1.17)
Paragon REIT (Price/NAV = 1.05)
Only 7 REITs are overvalued now based on Price/NAV value.
No change in the Top 2 compared to the past 2 months.
Most undervalued REITs (based on Price/NAV)
Lippo Malls Indonesia Retail Trust (Price/NAV=0.39)
Manulife US REIT (Price/NAV = 0.53)
ARA US Hospitality Trust (Price/NAV = 0.54)
BHG Retail Trust (Price/NAV = 0.54)
EC World REIT (Price/NAV = 0.57)
OUE Commercial REIT (Price/NAV = 0.58)
Distribution Yields Overview
TTM Distribution Yield decreased to 7.33%.
Decreased from 7.90% in January 2023.
15 of 40 Singapore REITs have distribution yields of above 7%.
Do take note that these yield numbers are based on current prices taking into account the delayed distribution/dividend cuts due to COVID-19, and economic recovery.
9 REITs have a ttm yield of over 10%!
Highest Distribution Yield REITs (ttm)
Manulife US REIT (16.38%)
Prime US REIT (13.51%)
EC World REIT (12.46%)
United Hampshire US REIT (11.57%)
Keppel Pacific Oak US REIT (11.26%)
Cromwell European REIT (10.60%)
Reminder that these yield numbers are based on current prices taking into account delayed distribution/dividend cuts due to COVID-19.
Some REITs opted for semi-annual reporting and thus no quarterly DPU was announced.
A High Yield should not be the sole ratio to look for when choosing a REIT to invest in.
Yield Spreadtightened to 4.12%.
Tightened from 4.69% in January 2023.
Gearing Ratios Overview
Gearing Ratio increased to 37.38%.
Increased from 37.20% from January 2023.
Gearing Ratios are updated quarterly.
S-REITs Gearing Ratio has been on a steady uptrend, from 35.55% in Q4 2019.
Highest Gearing Ratio REITs
Manulife US REIT (48.8%)
Lippo Malls Indonesia Retail Trust (43.7%)
ARA Hospitality Trust (43.3%)
Suntec REIT (43.1%)
United Hampshire US REIT (42.1%)
Prime US REIT (41.9%)
Market Capitalisation Overview
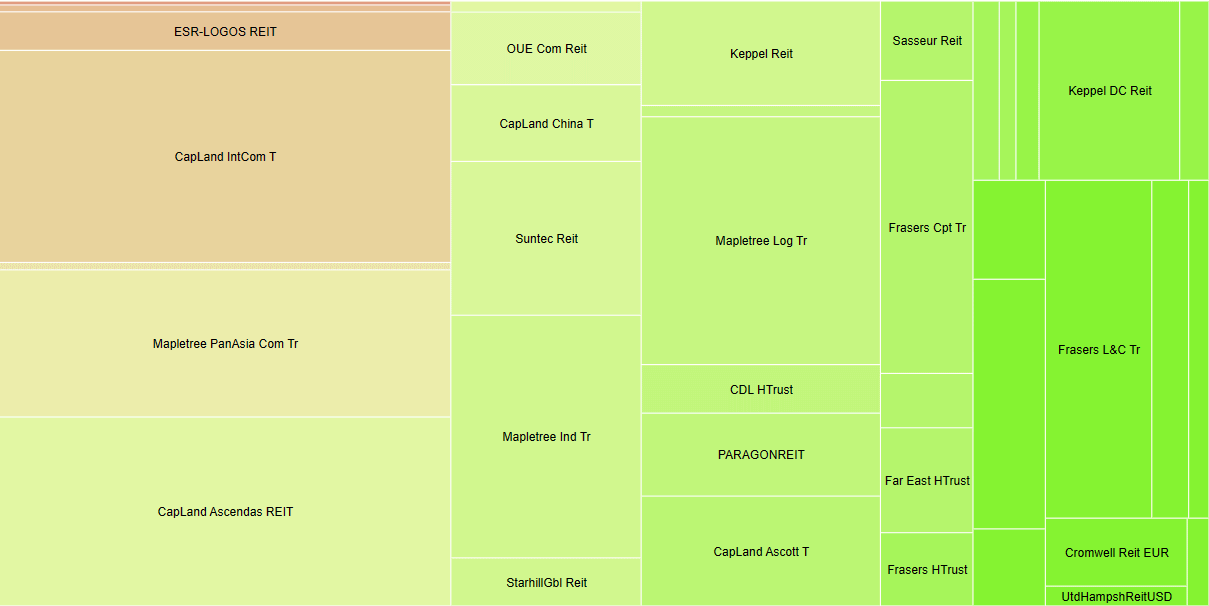
Total Singapore REIT Market Capitalisation increased by 3.56% to S$98.76 Billion.
Increased from S$95.36 Billion in January 2023.
Biggest Market Capitalisation REITs:
Capitaland Integrated Commercial Trust ($13.06B)
Capitaland Ascendas REIT ($11.63B)
Mapletree Pan Asia Commercial Trust ($9.06B)
Mapletree Logistics Trust ($8.08B)
Mapletree Industrial Trust ($6.29B)
Frasers Logistics & Commercial Trust ($4.90B)
No change in the rankings since September 2022.
Smallest Market Capitalisation REITs:
BHG Retail REIT ($244M)
Lippo Malls Indonesia Retail Trust ($262M)
ARA Hospitality Trust ($288M)
EC World REIT ($368M)
United Hampshire US REIT ($384M)
Elite Commercial REIT ($408M)
Disclaimer: The above table is best used for “screening and shortlisting only”. It is NOT for investing (Buy / Sell) decision. If you want to know more about investing in REITs, here’s a subsidised 2-day course with all you need to know about REITs and how to start investing in them.
Top 20 Best Performers of the Month in January 2023
As of 11th February 2023, 25 REITs have reported their earnings for Q4 2022.
Summary
Fundamentally, the whole Singapore REITs landscape remains undervalued based on the average Price/NAV (at 0.85) value of the S-REITs, with a very attractive DPU yield of 7.33%! The valuation and DPU yield still attractive after the recent rebound since the beginning of 2023.
Interestingly, despite 24 REITs being bearish and only 10 REITs being bullish in the past month, market cap overall has increased very slightly by 0.26%. This is due to larger market cap REITs doing well (eg. Capitaland Ascott Trust (S$3.5B, 11.11%), ESR-LOGOS REIT (S$2.5B, 7.25%), Frasers Centrepoint Trust (S$3.6B, 3.45%). Only 3 of the bottom 12 performing REITs have market capitalisations of over S$1B. The top 5 largest Market Cap REITs have performances varying between -0.45% and -2.34%.
Yield spread (in reference to the 10-year Singapore government bond yield of 3.13% as of 10th February 2023) tightened from 4.69% to 4.12%.This is a huge decrease 0.57%, due to the rise of the REIT index and the relatively unchanged Bond Yields, bringing ttm yields down.
(Technically, FTSE ST REIT Index is trading in a short-term uptrend channel (higher high, higher low chart pattern) since finding the bottom in Oct 2022. After breaking up from the bull flag pattern, the S-REIT index is currently retracing to test the previous resistance turned support at about 740. If this support holds, it is expected the S-REIT index to continue the bullish rebound with the next target 790-800 to breakout to enter into bull market.
Based on the current overall S-REIT P/NAV of 0.85 and the potential peaking of interest rate in Q2/Q3 2023, the probability to have a severe crash in S-REIT is low unless we are entering into severe recession with big drop in DPU and US Fed continues to increase the interest rate fiercely beyond 5%.) 2023 would be a cautiously bullish for S-REIT with fundamentally strong S-REITs.
OTCS Special Market Outlook 2023 – Inflation, US Markets and REITs
Do you know where are the risk and opportunities in 2023?
2022 saw rising inflation & S&P500 in down trend
Fed is planning to whatever it takes to tame inflation. Is it good for your portfolio?
Will the markets crash in 2023, or climb higher?
Shortly into 2023, we saw S&P500 recovering. Will it continue?
Timestamps
1:44:30 Intro
1:48:37 Market Recap: Singapore REIT Index performance; comparison with STI and Financial Index
1:58:02 US Fed Hike Rate
2:00:42Things to look out for in 2023
Keeping an eye on Net Asset Value/Unit and DPU growth trends
2:04:15Why you need to look at financial ratios of a REIT and not just yields:
EC World REIT Case Study: Debt Management
Unsecured Borrowings
2:08:35CapitalandAscott Trust Case Study
2:10:23 Manulife US REIT Case Study: Risk of breaching 50% gearing ratio limit
How MUST could try to reduce its gearing ratio
Portfolio valuation dror
2:15:03 My radio interview on the S-REIT Market Outlook for 2023 (or view here)
2:17:32 REIT Investing Strategy for 2023
REITs are cyclical, despite poor performance during 2022
2:19:39 Summary
2:22:12 How your Investment Portfolio should look like
Note: This above analysis is for my own personal research and it is NOT a buy or sell recommendation. Investors who would like to leverage my extensive research and years of Singapore REIT investing experience can approach me separately for a REIT Portfolio Consultation.
Kenny Loh is an Associate Wealth Advisory Director and REITs Specialist of Singapore’s top Independent Financial Advisor. He helps clients construct diversified portfolios consisting of different asset classes from REITs, Equities, Bonds, ETFs, Unit Trusts, Private Equity, Alternative Investments, Digital Assets and Fixed Maturity Funds to achieve an optimal risk adjusted return. Kenny is also a CERTIFIED FINANCIAL PLANNER, SGX Academy REIT Trainer, Certified IBF Trainer of Associate REIT Investment Advisor (ARIA) and also invited speaker of REITs Symposium and Invest Fair. You can join my Telegram channel #REITirement – SREIT Singapore REIT Market Update and Retirement related news. https://t.me/REITirement
The reality is inflation may be here longer than we’d like. So instead of just grumbling about it, let’s talk about how we can actually navigate inflation in our daily lives. Today’s episode features two guests: Chris from HoneyMoneySG (https://www.youtube.com/@HoneyMoneySG) and Kenny Loh, a well-known REIT investor.
Timestamps
Intro (0:25)
What are your thoughts on inflation? (2:42)
How Mortgage and Rental works (3:46)
How inflation affects us as individuals (5:48)
Ya Kun Kaya Toast (Set A) was $4.80 last year. Now it’s over $5.60/$5.80
What have you consciously adjusted in your spending? (8:20)
Food prices have increased by 10-20% across the board
So are transportation costs (e.g. Grab)
How I am less affected from inflation: (11:50)
1. Live a simple lifestyle: make your spending low
2. Multiple sources of income (especially outside of your full-time job)
E.g. hedging of inflation (dividends also increase)
Does being frugal affect your quality of life? (16:01)
How do you manage spending during inflation? (24:33)
What other sources of income that you think people can use? (25:33)
Any thoughts on investing fixes? (35:24)
Remember your financial objectives! (40:19)
Closing: One simple thing we can do to manage inflation (47:10)
Disclaimer: The content in The Financial Coconut is solely for education and entertainment purposes. It does not serve as any form of advice or recommendations. For all other links mentioned, or to discover more from the team at The Financial Coconut (including all our other shows), go to https://linktr.ee/thefinancialcoconut