Good Lesson Learnt on My CFD Trading (Shorting)
Disclaimer: The information shared below is not a recommendation to buy or sell. Readers should not copy any strategy here because everyone has different trading psychology, greed and fear threshold, holding time frame, risk tolerance and perception of the market direction. The information shared below is not a show off and BS that I am a guru. I am just a ordinary retail investor or trader who just started using CFD to short the stock market recently. My portfolio is a snapshot when the profit is the maximum. I have closed some of the positions when I write this post. I have shared what I have done wrong of my past trading and this post is to share what I have done right. I am using this opportunity to document my trading strategy so that I can continuously improve my win rate and consistency.

First time to see my portfolio all green when the stock market is red…. i.e. I am shorting the stocks. (Sell High First, Buy back at low later). What I have done right:
- Study the stock chart and candlestick everyday after market close. Note: I am not using MACD, RSI, etc technical indicators to time my entry. These Technical indicators are lagging indicator.
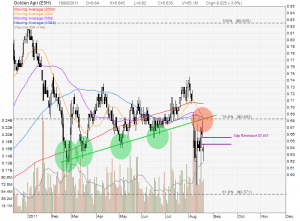
- I pay close attention when the stock price trades close to the resistance level and starts to turn down. I also look at any “gap down” oppportunity to short the stock.
- Only enter a trade where there is a clear chart pattern or candlestick pattern.
- Always calculate the profit potential vs loses risk before entering a trade. Profit Potential must be bigger than Losses Risk.
- I set stop loss for EVERY trade. I get burnt many times when I did not set stop loss in my past trades. Setting stop loss will let the machine takes over my emotion when the stock price does not go towards the direction I am hoping for. I am very disciplined this time to let the machine to “auto-close” my trades.
- I analyse the chart every day and review my stop loss. I move my stop loss to protect my profit and make sure I don’t lose money as first priority. It is OK not to make money in a trade but never lose money. Always remember Warren Buffet’s Rule #1: Never Lose Money, Rule #2: Don’t forget Rule #1.
- I set my profit target in every trade but monitor closely everyday if there is trend reversal candlestick. I will close my position immediately if there is a reversal pattern.
- Be VERY Discipline and follow through trading plan as much as possible.
- Let trading plan to take over my emotion.
- It is not possible to 100% get all the trades right. I have learned how to lose small money consistently for wrong trade and make more than 50% profit for right trade.
Welcome for any additional comments to help me to improve my CFD Trading.