Don’t Leave Their Future to Chance: Why Young Families Need an Estate Plan Now
For most young parents, “estate planning” sounds like something reserved for the wealthy or the elderly. But if you have minor children, an estate plan isn’t about how much money you have; it’s about legal guardianship and protection. It is the ultimate act of parental responsibility—ensuring that if the unthinkable happens, your children are raised by the people you choose and supported by the assets you’ve worked hard to build.
The Hidden Risks of Silence
Leaving your family’s future to “the system” creates three immediate crises:
- The Guardianship Gap: Without a legal Will naming guardians, your children could be placed in temporary protective custody (foster care) while a judge—a stranger—decides which relative is most “fit” to take them.
- The “Eighteen-Year-Old” Windfall: In many jurisdictions, if you die without a trust, your children receive their entire inheritance in one lump sum the moment they turn 18 (Singapore 21). Most teenagers aren’t equipped to manage a house, life insurance payouts, and savings accounts responsibly.
- The Probate Drain: Without a plan, your assets can be locked in probate court for years. This “freezes” your bank accounts, meaning your family might not have the cash flow to pay for the mortgage or school fees during the most stressful time of their lives.
The Solution: The “Umbrella” of Protection
Think of estate planning as an “Umbrella Strategy.” You don’t buy a car seat because you expect to crash; you buy it so your child is safe if you do. Your estate plan should consist of three core layers:
1. Legal Guardianship & The Letter of Wishes
This is your voice in the room when you aren’t there. You formally name Testamentary Guardians to provide physical care. To go a step further, include a Letter of Wishes. This is a personal guide for the guardians detailing your values, your hopes for your children’s education, and even small details like their favorite traditions.
2. The Protective Trust Structure
Instead of giving money directly to children, assets should be held in a Trust. You can use a “Pot Trust” strategy, which keeps the family’s wealth in one pool to cover all children’s needs—like healthcare and education—until the youngest reaches a certain age. This ensures that a five-year-old has the same financial support for college that their older sibling already received.
3. Asset & Remarriage Protection
A well-structured trust protects your children’s inheritance from more than just their own youth. It shields the money from future creditors, lawsuits, or a messy divorce. It also prevents “accidental disinheritance,” ensuring that if a surviving spouse remarries, your assets are legally earmarked for your children rather than a new partner.

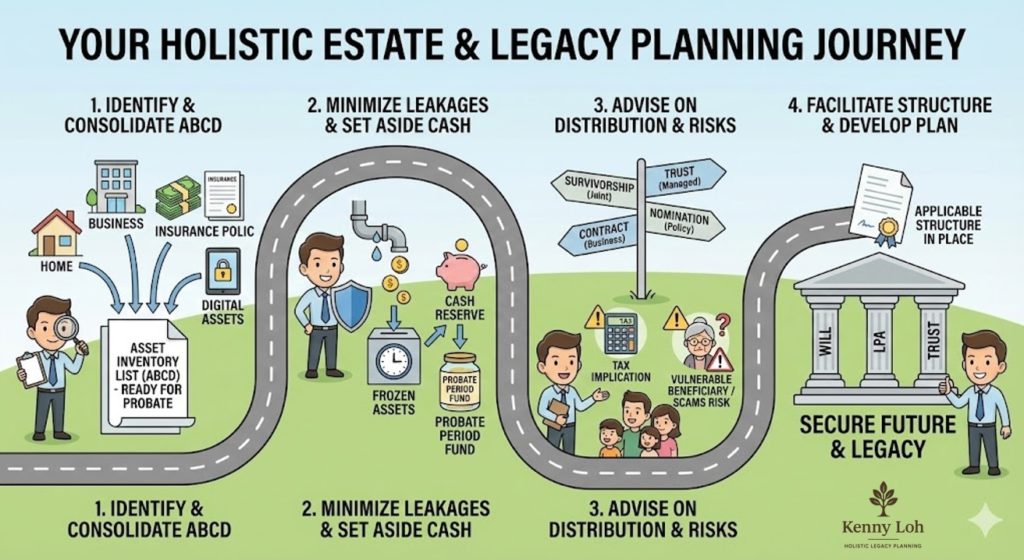
Building the Right Structure
To help a family move from “exposed” to “protected,” we follow a comprehensive process. We begin by drafting a Will to establish the legal foundation of guardianship and executors. Next, we implement a Living or Testamentary Trust to dictate exactly how and when wealth is distributed, ensuring it’s used for the children’s Health, Education, Maintenance, and Support (HEMS).
Beyond the assets, we ensure Liquidity by aligning life insurance policies with the trust so cash is available immediately. Finally, we establish Durable and Healthcare Powers of Attorney. This ensures that if you are only temporarily incapacitated, a trusted person can manage your finances and make medical decisions without your family having to sue for guardianship in court.
Your Next Step
Don’t let a judge decide who raises your children or how your hard-earned assets are spent. By putting a structure in place today, you are giving your family the gift of certainty.
Important: The information and opinions in this article are for general information purposes only. They should not be relied on as professional financial advice. Readers should seek unbiased financial advice that is customised to their specific financial objectives, situations & needs. This advertisement or publication has not been reviewed by the Monetary Authority of Singapore.
Kenny Loh is a distinguished Wealth Advisory Director with a specialization in holistic investment planning and estate management. He excels in assisting clients to grow their investment capital and establish passive income streams for retirement. Kenny also facilitates tax-efficient portfolio transfers to beneficiaries, ensuring tax-efficient capital appreciation through risk mitigation approaches and optimized wealth transfer through strategic asset structuring.
In addition to his advisory role, Kenny is an esteemed SGX Academy trainer specializing in S-REIT investing and regularly shares his insights on MoneyFM 89.3. He holds the titles of Certified Estate & Legacy Planning Consultant and CERTIFIED FINANCIAL PLANNER (CFP).
With over a decade of experience in holistic estate planning, Kenny employs a unique “3-in-1 Will, LPA, and Standby Trust” solution to address clients’ social considerations, legal obligations, emotional needs, and family harmony. He holds double master’s degrees in Business Administration and Electrical Engineering, and is an Associate Estate Planning Practitioner (AEPP), a designation jointly awarded by The Society of Will Writers & Estate Planning Practitioners (SWWEPP) of the United Kingdom and Estate Planning Practitioner Limited (EPPL), the accreditation body for Asia.
If you need any financial advice, please contact kennyloh@fapl.sg
罗国强(Kenny Loh) 是一位杰出的财富咨询总监,专长于综合投资规划与遗产管理。他擅长协助客户实现投资资本增值,并建立退休被动收入来源。同时,他通过税务优化的方式帮助客户将投资组合高效转移给受益人,运用风险缓释策略确保资本增值的税务效率,并通过战略性资产配置实现财富传承的最优化。
除咨询工作外,罗国强是新加坡交易所学院(SGX Academy)的特聘讲师,专注于新加坡房地产投资信托(S-REIT)投资领域,并定期在MoneyFM 89.3电台分享专业见解。他拥有认证遗产与传承规划顾问(Certified Estate & Legacy Planning Consultant)及国际认证财务规划师(CFP)资格。
在逾十年的综合遗产规划经验中,他独创“遗嘱、持久授权书与备用信托三合一”解决方案,兼顾客户的社会责任、法律义务、情感需求及家庭和谐。他持有工商管理硕士与电气工程硕士双学位,并获英国遗嘱撰写及遗产规划从业者协会(SWWEPP)与亚洲认证机构遗产规划从业者有限公司(EPPL)联合授予副遗产规划从业师(AEPP)专业资格。
Arrange for a non-obligatory one-to-one free consultation here!
立即预约免费一对一咨询(无需承担任何义务)!