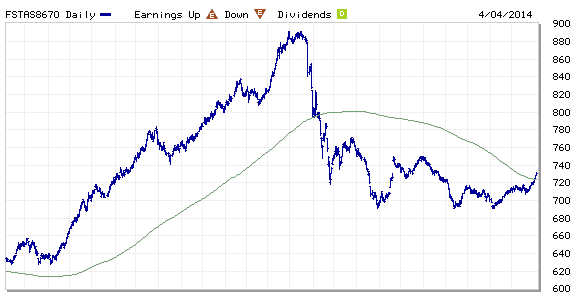
FTSE ST Real Estate Investment Trusts (FTSE ST REIT) Index changes from 714.18 to 731.88 compare to last post on Singapore REIT Fundamental Comparison Table on Mar 1, 2014. The index is trading above 200D SMA (moving sideway) after breaking out from a Descending Triangle. A trend reversal in making base on technical analysis.
- Price/NAV increases from 0.9687 to 0.9930.
- Dividend Yield decreases from 6.84% to 6.72%
- Gearing Ratio maintain at 34.00%.
- In general (base on quantitative analysis and technical analysis), most Singapore REIT is slightly under value now and the distribution yield is attractive (but with risks). Most of the Singapore REITs are trading in a consolidation range but some REITs have broken the 200D SMA resistance. These REITs may start an uptrend soon if they are able to stay above the 200D SMA as support.
- There are one key negative point to take note when investing in Singapore REITs:
- The uncertainty in term of interest hike in near future remains high as Federal has started the QE tapering. Any hike in interest will affect the distribution income (reduction), NAV (value drops) and also the gearing ratio (increase) of the REIT. All of these will weaken the fundamental of the REIT and affect the REIT share price.
- Singapore Interest Rate is creeping up quietly but you don’t see BIG news in the newspaper. Look at the % of increase in 2014, from 0.05% to 0.2% — 4X!

- And look at the past high in 20 years! The interest rate can go to as high as 10% and average at about 4%. The current interest rate is chicken feet! There is one thing GUARANTEE that interest rate will SURE go up! Everyone should be very cautious about the interest impact on your current investment and mortgage loan. It is extremely important to equip yourself with financial knowledge now before it is too late in you want to stay in this investing world. No excuse for financial ignorant because you are fully responsible on your own investment.

- However there are some REITs in Singapore have been managing their debt maturity profile pretty well and have minimum impact if there is an increase in interest rate. The DPU should not be affected much and the risk of DPU reduction is minimal. The key thing here is how to find out those “Gem” by applying the right method to analyse the Risks. Join the next workshop on “How to pick Singapore REIT for Dividend Investing” to learn how to do Quantitative, Qualitative Analysis and Risk Assessment Plus Identify the Trend on Singapore REITs so not to miss out any opportunity to pick up “Low Risk REITs with Decent Dividend Yield”.
- Visual Comparison for Singapore REITs using Bubble Charts.


I do not see Mapletree Logistics Trust listed in the table?
Is there any chance that you could post these as a down loadable Excel file? It would be much appreciated.
Re Singapore REITS – is there any chance that you could publish these as a downloadable Excel file? This request was also made by another follower at one of your recent workshops and would be appreciated by many I am sure.
@David: I have created a closed group in Facebook for my students who attended the REIT workshop to download the excel spreadsheet template. Please send me an email marubozu@mystocksinvesting.com and indicate your full name (during past registration) and which workshop date you have attended. I will add you to the closed group and you will see other REIT related analysis and reports.