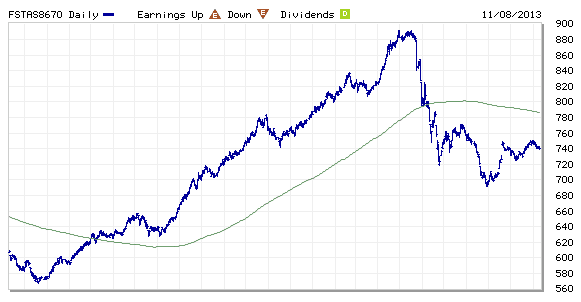
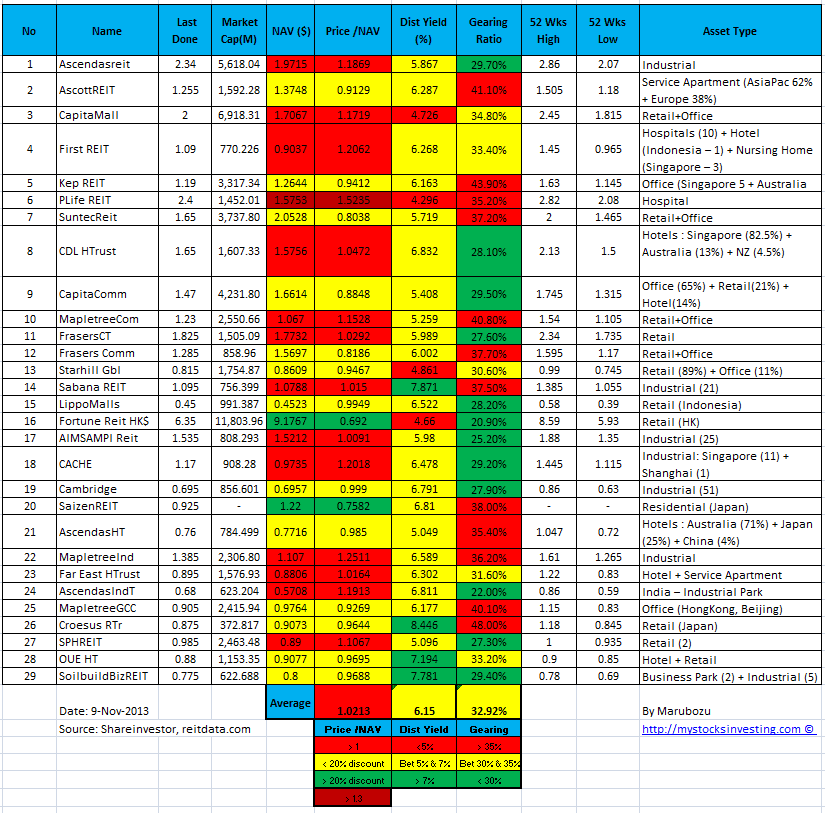
FTSE ST Real Estate Investment Trusts (FTSE ST REIT) Index changes from 735.74 to 740.76 compare to last post on Singapore REIT Fundamental Comparison Table on Oct 12, 2013. The index is still trading below 200D SMA and technically bearish. However, there is sign of potential reversal if the index break the recent high of 750 as it will be forming an Inverted Head and Shoulders, a reversal chart pattern. Currently the index has moved out from the down trend channel and trading sideway. 750 is the resistance to watch. Fundamentally there is still a fear of interest hike in near future which dampen the investment sentiment in REIT.
Compare to last Singapore REIT comparison table:
- Price/NAV increases from 1.018 to 1.0213.
- Dividend Yield decreases from 6.23% to 6.15%.
- Gearing Ratio reduced from 33.07% to 32.92%.
- In general, Singapore REIT is at the Fair Value and the distribution yield is reasonable. However technically Singapore REIT is in the bearish territory and in consolidation phase. So do not expect any big stock price upward movement for capital gain. The uncertainty in term of interest hike in near future remains high and this causes limited upside potential for Singapore REITs or even wipe out your initial capital invested in REIT. Invest safe and this is not the time to be hero in REIT investing until the cloud is clearer. More importantly investors must know how to GET OUT if the charts turn bearish and start another down trend again.
Find out how do I conduct research on Singapore REIT, how to interpret those financial ratio in the comparison table, when is the best time to buy using simple Trend Analysis. Furthermore it is important to understand the BIGGER TREND so that your investment will not be losing money in the down trend market. Find out WHERE and HOW to read the FTSE ST Real Estate Investment Trust Index because timing is very critical in making any investment decision. Check out my next public tutorial on “How to pick Singapore REIT for Dividend Investing” .


