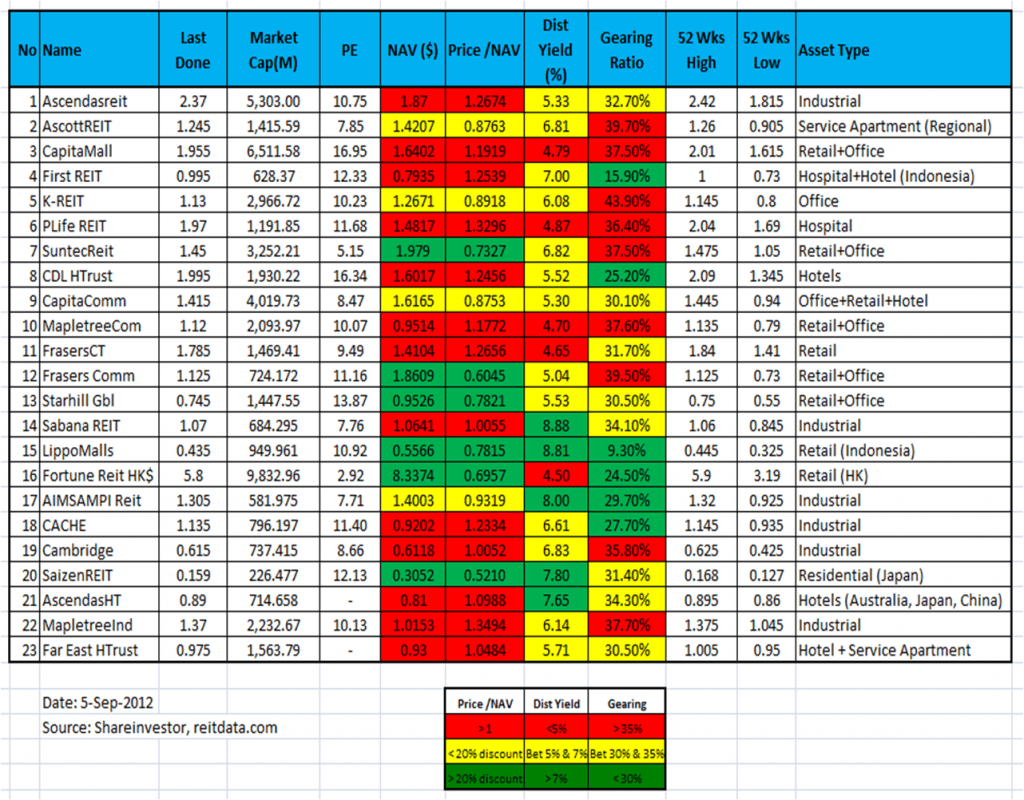
Latest Comparison table for Singapore REIT in terms of Market Cap, PE ratio, NAV, Gearing Ratio, Distribution Yield and Asset Type.
Added: Far East Hospitality Trust (recent IPO)
Far East Hospitality Trust Prospectus
Property of Far East HTrust – Hotels & Service Apartments.
Last comparison table of Singapore REITs.
Some readers requested me to conduct class to teach how to select a right REIT for dividend investing and explain the terminology of financial ratio of the above table. Please check out the class detail on REIT investing by clicking HERE (REIT Investing Class).


Hi,
I was looking at your reitdata.com and your blog. Noticed that the NAV for some of the reits are different, e.g. FrasersComm, K Reit, Suntec Reit. Why is this so?
Thanks.
I took the NAV directly from Shareinvestor.
NAV = (Total Asset – Total Liabilities) / Total Number of Outstanding shares
The difference is probably due to the difference in getting the numbers from the Financial Years or the latest quarter from the balance sheet. If the REIT manager issue additional units to the Management as compensation, it will also affect the number of shares. You can read the detail notes in the calculation.