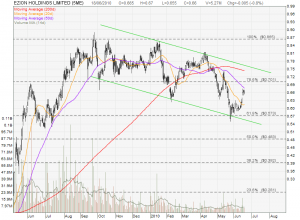
Ezion is currently trading in a Down Trend Channel. The stock is forming a “Lower High, Lower Low” chart pattern.
Downside risk is higher because Ezion will be facing a few resistances between $0.67 to $0.75:
- 50D MA
- 78.6% Fibonacci Retracement Level
- 200D MA
- Down Trend Channel Resistance
If the Down Trend Channel pattern is still valid, Ezion will probably go below $0.573 in the next few months.

