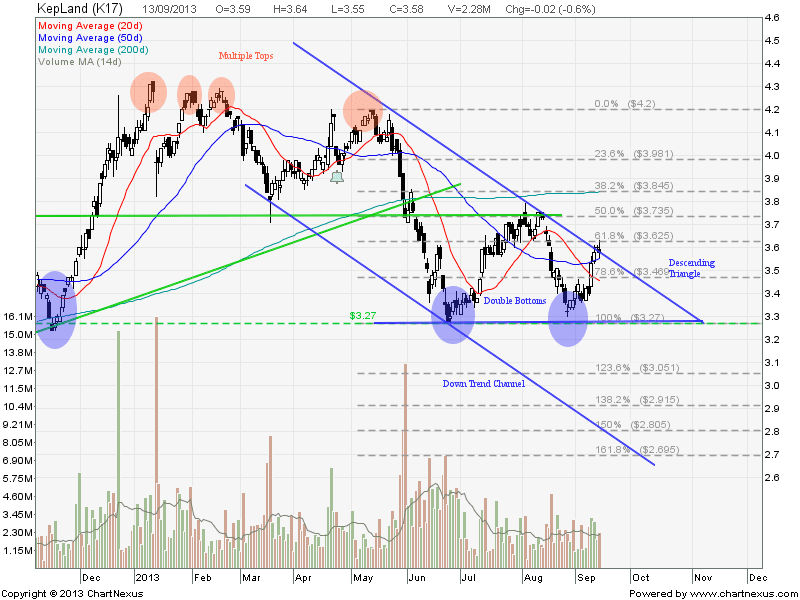
There are a few chart patterns observed in Keppel Land Chart. Keppel Land is currently trading in a Descending Triangle (Range between $3.62 and $3.27). If $3.27 support is broken, Keppel Land will continue the fall in a Down Trend Channel with price target at about $2.70 (also the 161.8% Fibonacci Retracement Level).
Alternate scenario will be Keppel Land breaks the Triangle resistance at about $3.62 and $3.735 (neckline of Double Bottom), this pattern will confirm the trend reversal to upside.
Critical Level to watch:
- $3.27 Support
- $3.62 Resistance
Last Analysis on Keppel Land.


KK,
Keppel Land broke resistance of $3.62 today. Does that mean it is trending up? Will the Fed meeting on Wed further boost this stock if cutting QE by only abit as expected? thx
Not uptrend yet. Still have the neckline resistance to break.
Wait for the forming of “higher high, higher low” to confirm the trend reversal. Also note that today rally is very much news driven. The market will be very volatile and it is better to wait for the FOMC news first.
Don’t be gancheong the market is always there for you to trade especially you know how to long and how to short.
Hi KK,
Keppelland briefly broke through $3.735 after FOMC, now it has fallen back to 3.65 to 3.70 range. It is not longer in the “lower low and lower high” condition. Does this mean it has broken from the downtrend? What should we be looking out for in this case? For example, should we look to short after it breaks its resistance turn support point of $3.62? or is this a double bottom? thx
You should have received my reply to your personal email if you provide a valid email.
Could you pls analyse Kepland?
Thanks
Vicky, you can check the latest analysis for Kepland here. https://mystocksinvesting.com/singapore-stocks/keppel-land/kepland-more-down-side-to-come/