Sabana REIT Fundamental Analysis (Base on April 20 Quarterly Earning)
- Last Done Price = $0.86
- NAV = $1.04
- Price / NAV = 0.827 (17.3% Discount)
- Price / NAV (High) = 1.25
- Price / NAV (Low) = 0.81
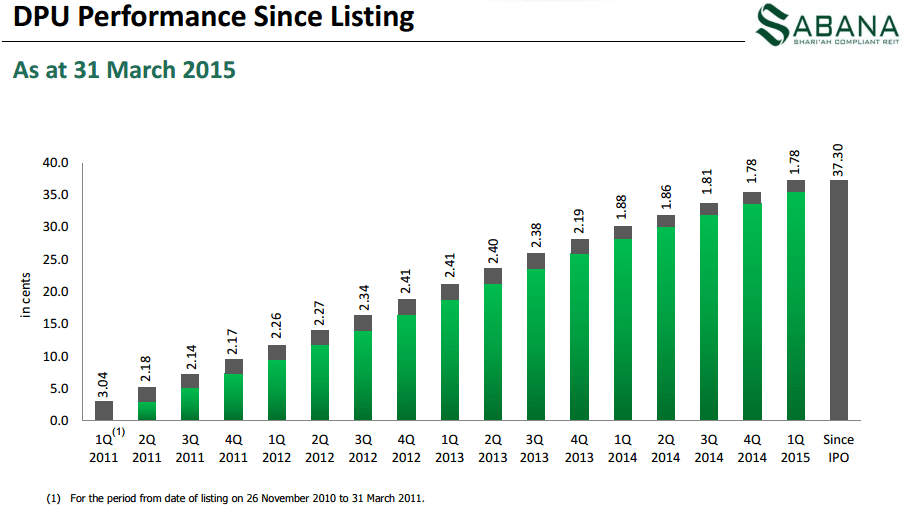
- Distribution Yield = 8.395%
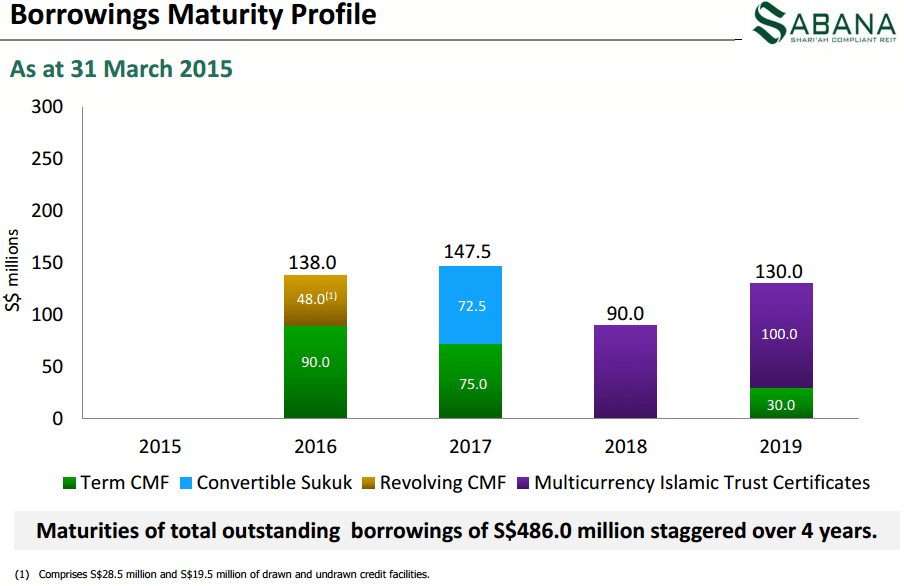
- Gearing Ratio = 38%
- WALE = 2.2 Years
- WADB = 2.8 Years
Sabana REIT Technical Analysis
Sabana REIT is currently on down trend but may be finding a support at the historical low price. Looks for the bottoming up chart pattern when the down trend stops.
Summary
Sabana REIT is undervalue and have high distribution yield. The stock price is also at the historical low. It may look attractive if just purely base on the number but one must understand what are the risk factors behind the numbers. However, the upside potential is very high if Sabana REIT can overcome all those risks. Look out for those improvement signs before jumping in.


