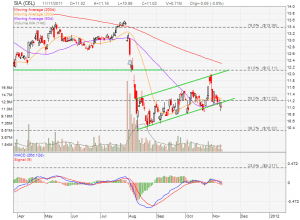
Singapore Airlines (SIA) looks like dropping out from a mini up trend channel support after the recent poor earning announcement. MACD is weakening and the stock price is trading below 20D, 50D and 200D MA. Also take note that 20D MA starts to turn down.
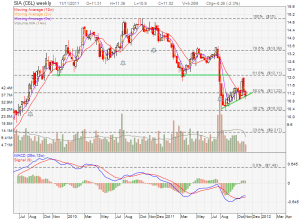
SIA is still on the long term down trend as its 200D MA is sloping down on the daily chart. SIA is also trading just below 2W, 5W, 12W MA of the weekly chart.
Watch this $11.00 support level. Breaking below this support may send SIA down to $9.20 target price of the Head and Shoulders chart pattern. SIA may rebound from this support level but taking into the macro-economy into consideration where most of the corporate have started to impose international travel freeze, the uncertainty in European debt crisis and the high level of oil price, I don’t see the any positive catalyst to proper SIA to the uptrend.


