Weekly Inter Market Analysis Oct 23-2016
See previous week Weekly Inter Market Analysis.
Original post from https://mystocksinvesting.com
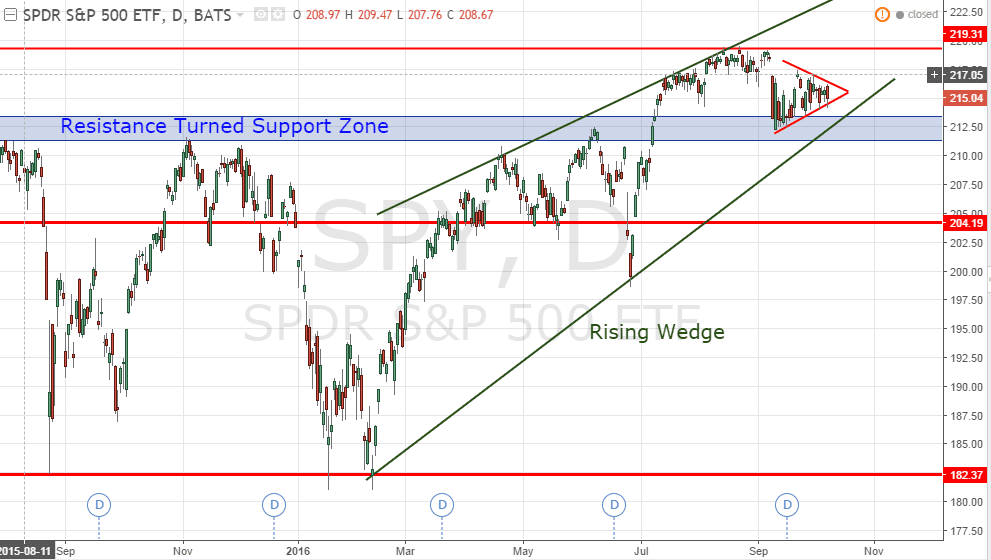
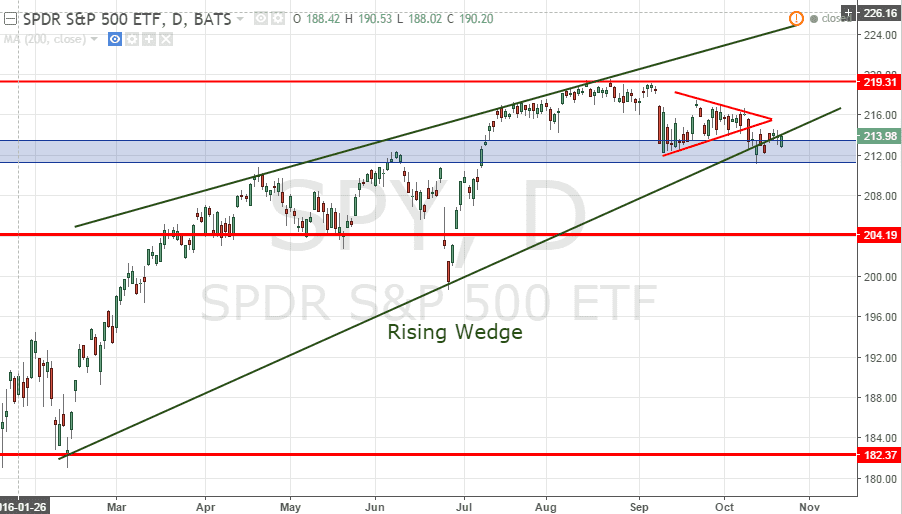
SPY (SPDR S&P500 ETF)
SPY is still staying above the big Rising Wedge support after broke down from a Symmetrical Triangle. Keep an eye this coming week to see whether there is a follow through of this breakdown.
- Resistance turned support zone: 211-213
- Rising Wedge immediate support: about 210
- Previous Head and Shoulders neckline support: about 204.
- Rising Wedge next support: about 200
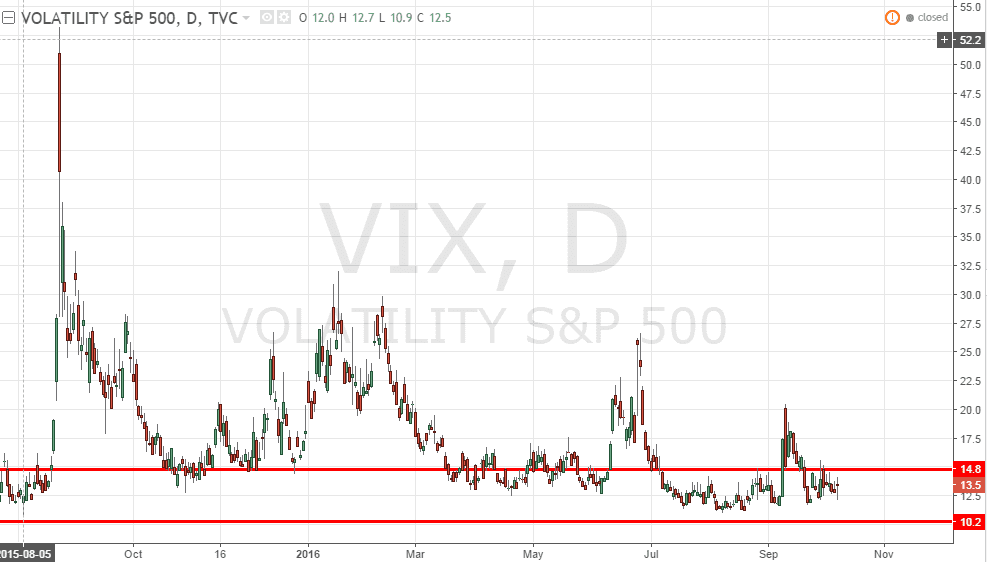
VIX
VIX dropped below 15 again, a complacent zone. Still no fear in the stock market.

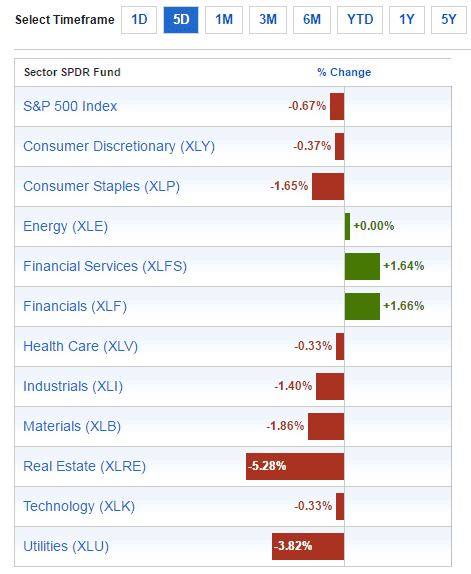
Sector Performance (SPDR Sector ETF)
- Best Sectors: Material (XLB) +1.60%
- Worst Sector: Industrial (XLI) -0.24%

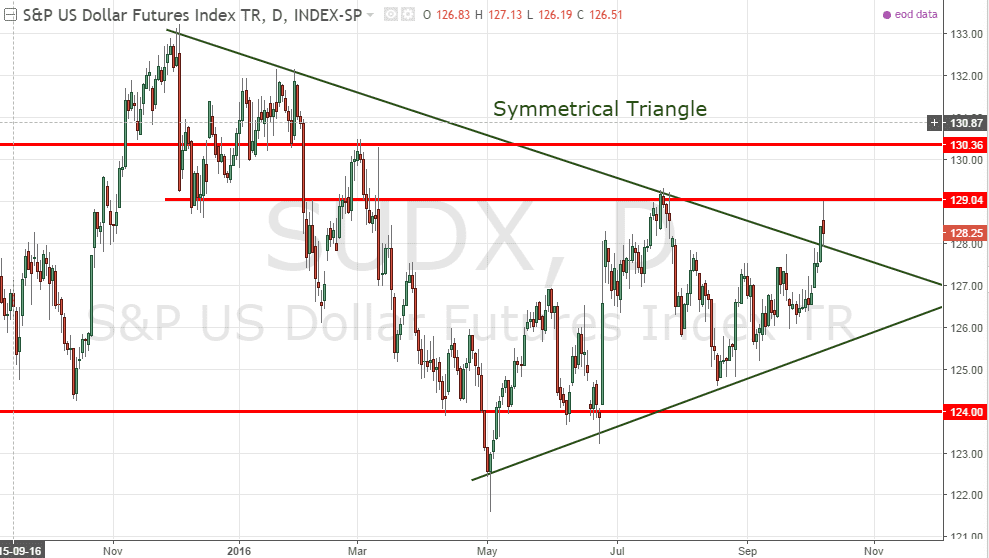
SUDX (S&P US Dollar Futures Index)
SUDX broke out from the Symmetrical Triangle and broke the next resistance at 130.36. If this continues, SUDX will start a confirm uptrend.

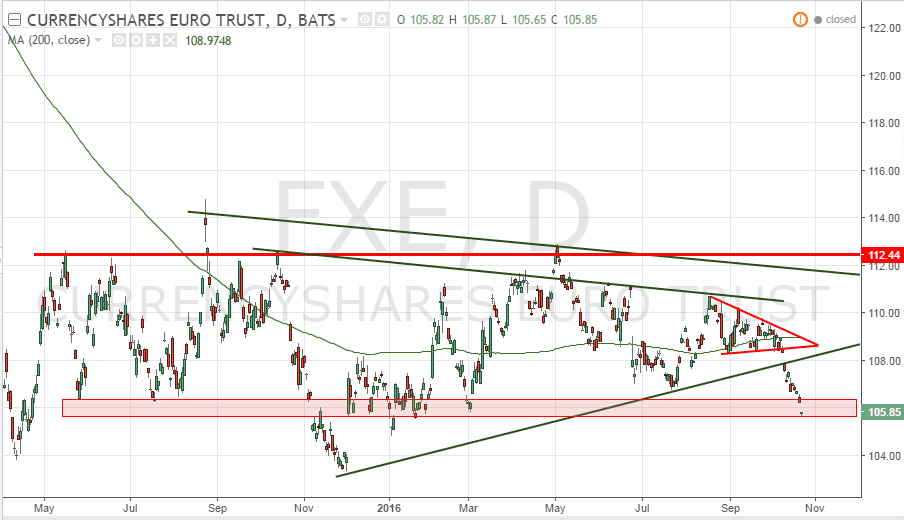
FXE (Currency Shares Euro ETF)
FXE broke the rising trend support and currently testing a critical support. If this support (red zone) is broken, FXE is expected to star a next down trend move.
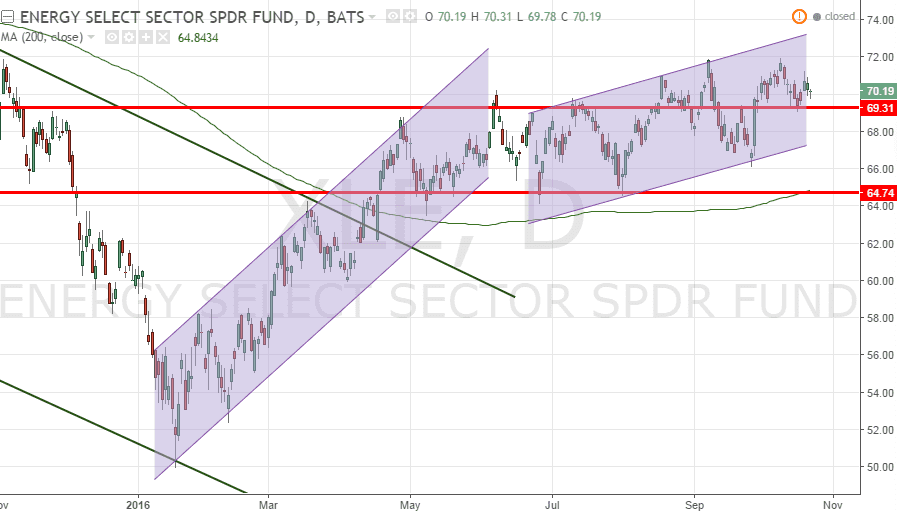
XLE (SPDR Energy Sector ETF)
XLE is expected to trade within the up trend channel. 200D SMA is starting to trend up. Keep an eye of the energy sector recovery (driven by Crude Oil, see USO chart)
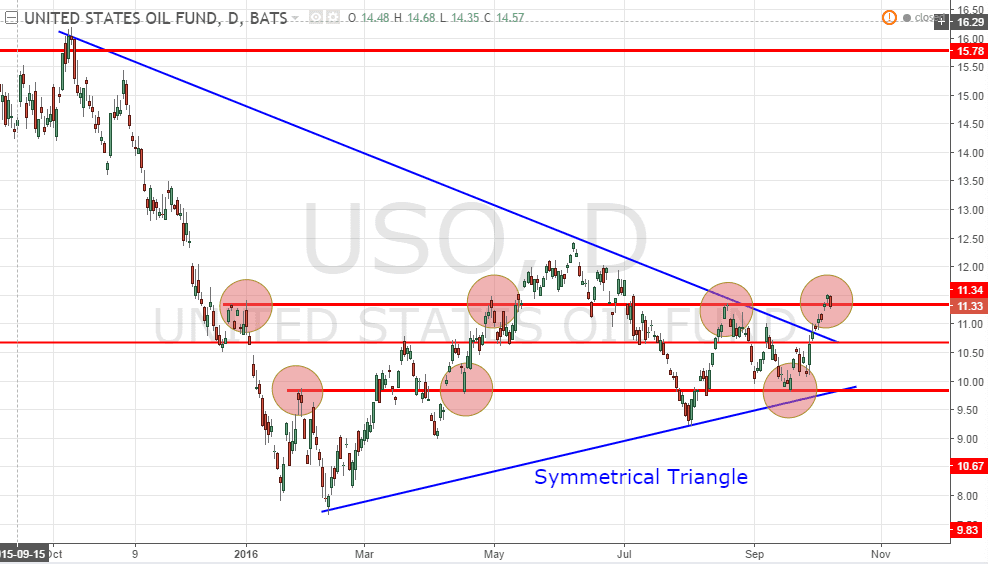
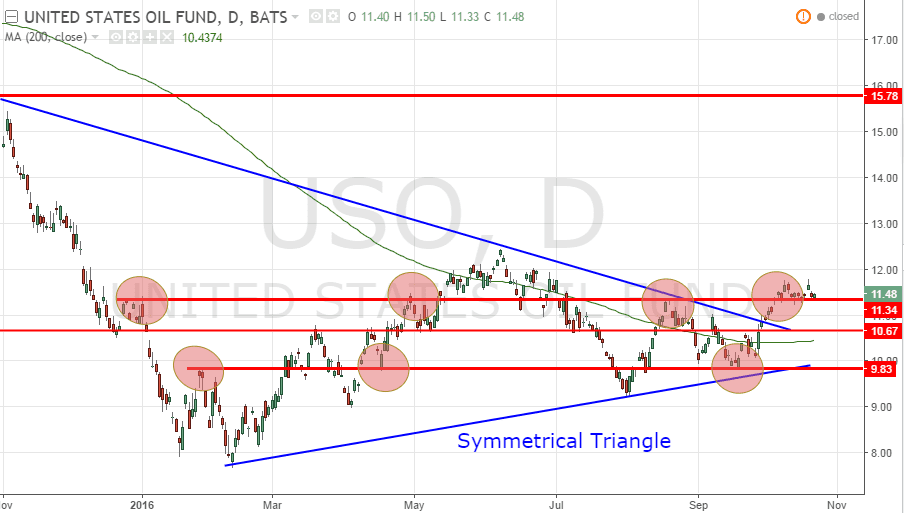
USO (United States Oil Fund)
USO broke the resistance. If USO can stay above this resistance (about $11.44) and make this level a resistance turned support, USO will start an uptrend.
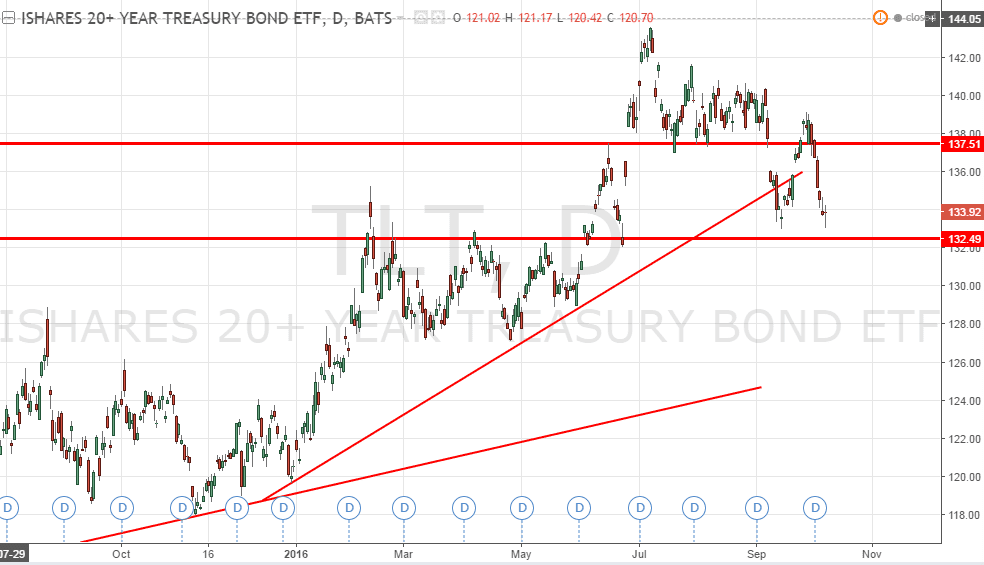
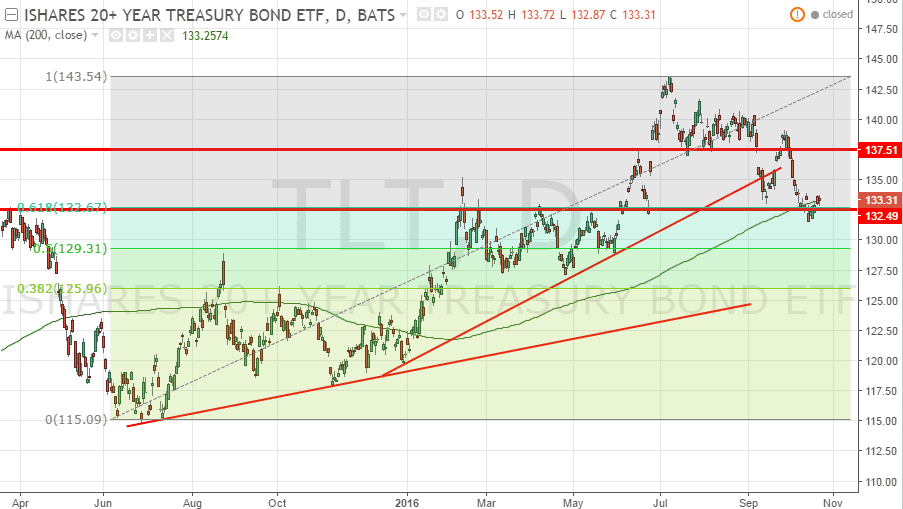
TLT (iShares 20+ Years Treasury Bond ETF)
TLT rebounded from the support at 132.5 and just closed just above the 200D SMA! 200D SMA is still trending up and coincides to 61.8% Fibonacci Retracement Level. This will be an attractive entry point if this 200D SMA support is valid.
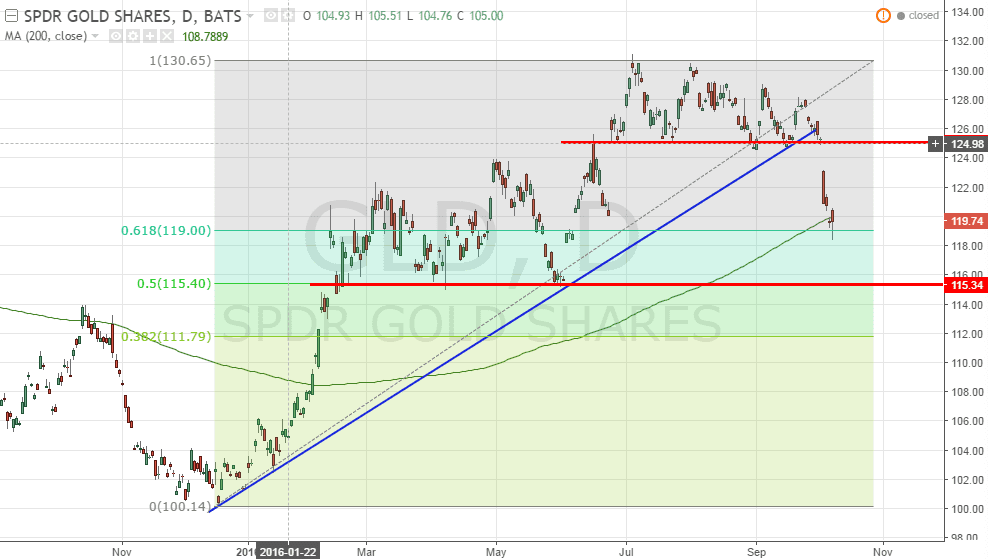
GLD (SPDR Gold Shares)
- GLD looks like rebounded from the 200D SMA support. 200D SMA is trending up.
- GLD is also sitting on the 61.8% Fibonacci Retracement Support.
- Expect GLD to rebound from level.

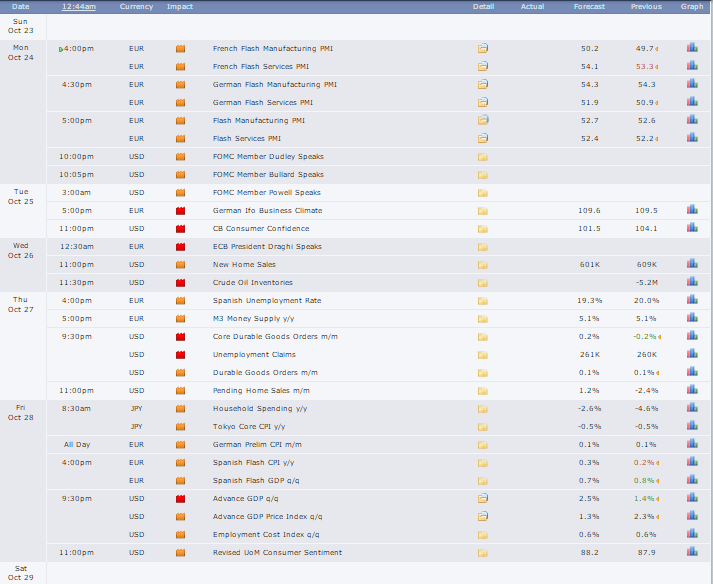
Next Week Economic Calendar
Key events:
- Germany Manufacturing PMI Oct 24 (Monday)
- ECB President Draghi speaks on Oct 26 (Wednesday)
- Crude Oil Inventory on Oct 26 (Wednesday)
- Pending Home Sales on Oct 27 (Thursday)
See other Events here. https://mystocksinvesting.com/events/