Semb Marine: Breakout from Descending Triangle?

  • Post author:

Looks like Semb Marine is breaking out from Descending Triangle and the 50D SMA resistance. This 50D SMA used to be a tough resistance for past 5 occasions. Immediate resistance at $3.30 followed by the 200D SMA. Immediate support is the 50D SMA.

2015Apr14-SembMar-800x600

Original post by Marubozu My Stocks Investing Journey.

Current P/E Ratio (ttm) 11.4051
Estimated P/E(12/2015) 11.6350
Relative P/E vs. FSSTI 0.8142
Earnings Per Share (SGD) (ttm) 0.2683
Est. EPS (SGD) (12/2015) 0.2630
Est. PEG Ratio 5.8030
Market Cap (M SGD) 6,391.54
Shares Outstanding (M) 2,088.74
30 Day Average Volume 2,905,500
Price/Book (mrq) 2.1566
Price/Sale (ttm) 1.0958
Dividend Indicated Gross Yield 4.25%
Cash Dividend (SGD) 0.0800
Dividend Ex-Date 04/27/2015
5 Year Dividend Growth 3.40%
Next Earnings Announcement 04/27/2015
Continue ReadingSemb Marine: Breakout from Descending Triangle?

Apple (AAPL): Short Term Consolidation

  • Post author:

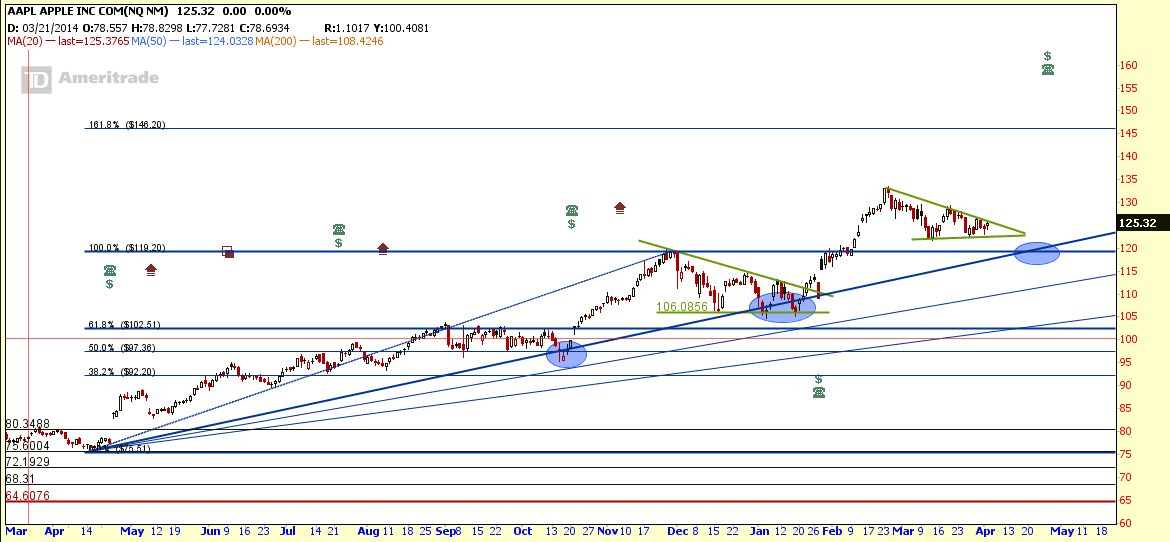
Apple (AAPL) is currently consolidating in a Descending Triangle. Immediate support is at the 120-122 zone. In general, the trend is still up for AAPL.

AAPL April3-2015 AAPL Fundamental April3-2015


AAPL Intrinsic Value

See last AAPL Intrinsic Value Analysis here.

Want to learn how to calculate the Intrinsic Value of any stock before making any investing decision, check out the hands-on Fundamental Analysis class here. Stock market investing is all about timing. You can also minimize your investing risk by knowing when to buy / when to sell through technical analysis.


Continue ReadingApple (AAPL): Short Term Consolidation

Keppel Corp: Bottoming Up?

  • Post author:

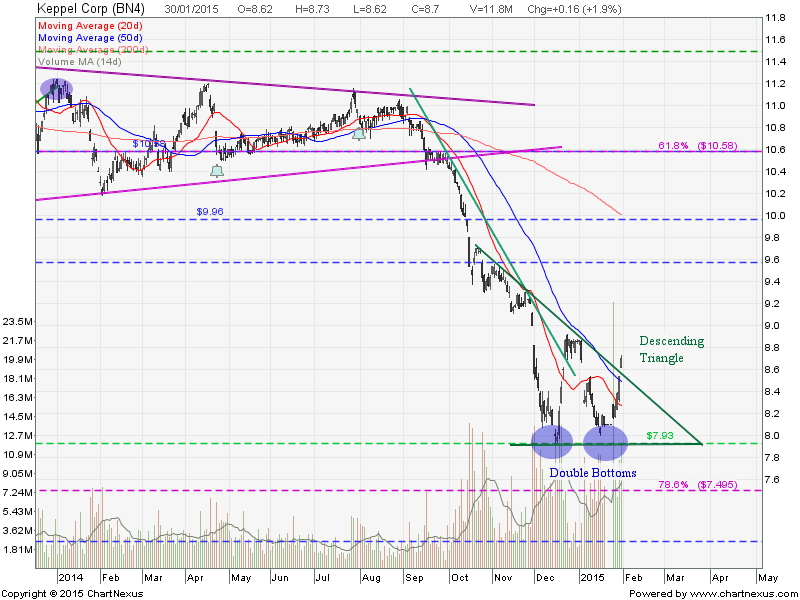
Keppel Corp looks like have bottoming up and showing reversal chart pattern. Breaking out from Descending Triangle is a first sign but Kep Corp will be facing the gap resistance and the Double Bottoms neckline resistance between $8.80 and $8.90. Need to wait for all these confirmation to confirm the trend reversal.

2014Jan30-KepCorp-800x600

Original post by Marubozu from My Stocks Investing Journey.

Current P/E Ratio (ttm) 8.3815
Estimated P/E(12/2015) 9.7643
Relative P/E vs. FSSTI 0.6204
Earnings Per Share (SGD) (ttm) 1.0380
Est. EPS (SGD) (12/2015) 0.8910
Est. PEG Ratio 4.0348
Market Cap (M SGD) 15,763.30
Shares Outstanding (M) 1,811.87
30 Day Average Volume 6,827,027
Price/Book (mrq) 1.5235
Price/Sale (ttm) 1.1885
Dividend Indicated Gross Yield 5.52%
Cash Dividend (SGD) 0.3600
Dividend Ex-Date 04/22/2015
5 Year Dividend Growth 5.12%
Next Earnings Announcement 04/16/2015
Continue ReadingKeppel Corp: Bottoming Up?