Singapore REIT Fundamental Analysis Comparison Table – 8 Feb 2014

  • Post author:

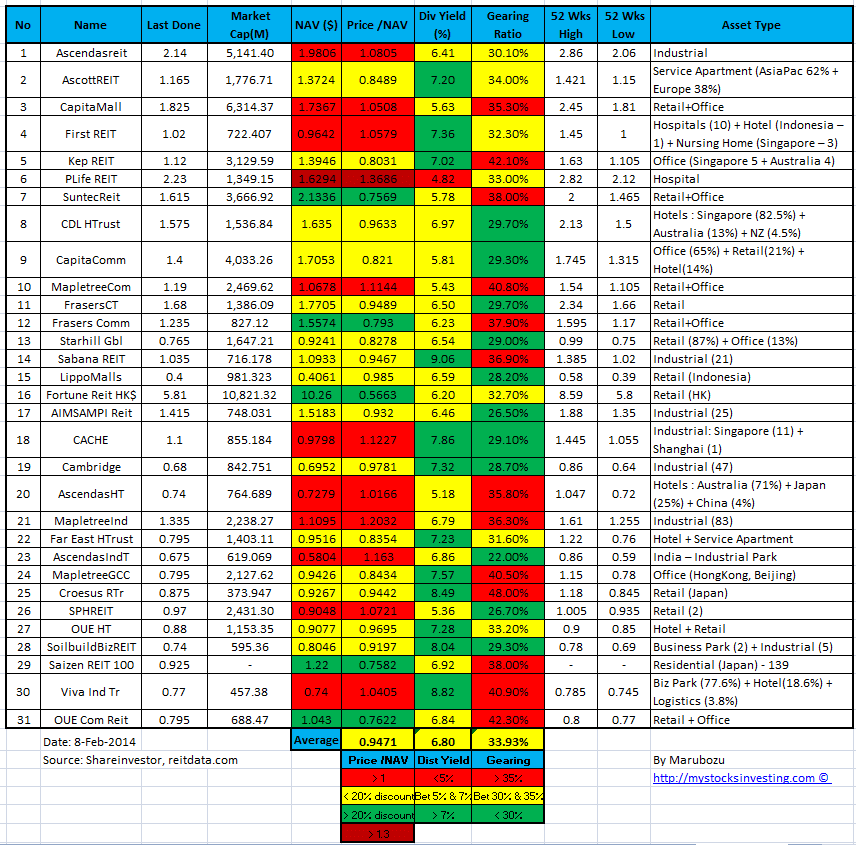
FTSE ST Real Estate Investment Trusts (FTSE ST REIT) Index changes from 714.92 to 696.54 compare to last post on Singapore REIT Fundamental Comparison Table on Jan 2, 2014. The index is trading below 200D SMA and technically bearish. The index is current testing the support at about 690 with the formation of Descending Triangle. Breaking down from this Descending Triangle will trigger more selling of Singapore REITs.

FTSE ST REIT Index Feb8-2014

Compare to last Singapore REIT comparison table:

  • Added OUE Commercial REIT.
  • Price/NAV decreases from 1.001 to 0.9471.
  • Dividend Yield increases from  6.34% to 6.80%.
  • Gearing Ratio increases from  33.34% to 33.93%.
  • In general, most Singapore REIT is slightly under value now and the distribution yield is reasonable. However technically Singapore REIT is in the bearish territory and going to drop further if the 690 support (FTSE ST REIT Index Chart) is broken. So don’t be ignorant to think this is the time to buy REIT yet as the price can drop further.  The uncertainty in term of interest hike in near future remains high as Federal has started the QE tapering after a series of good economy data in US. Any hike in interest will affect the distribution income (reduction), NAV (value drops) and also the gearing ratio (increase) of the REIT. All of these will weaken the fundamental of the REIT and affect the REIT share price. If you are still holding REIT at the moment, you need to have a strong heart to handle the potential new drop in your REIT. Investors need to look at the TOTAL Profit & Loss (Initial Capital + Dividend) in any REIT investment analysis. It is no point to gain the Annual Dividend of 8% but lose the capital invested of 10% within 2 weeks (if the share price drop by 10% in 2 weeks). This is extremely possible as currently Singapore REITs in in the bearish down trend.

Singapore REIT NAV Gearing Distribution Yield Comparison Table 8-Feb-2014

Find out how do I conduct research on Singapore REIT, how I color code and interpret those financial ratio in the comparison table, and why am I NOT touching any REIT at the moment although some REITs are undervalue. Find out WHERE and HOW to read the FTSE ST Real Estate Investment Trust Index because timing is very critical in making any investment decision.  Check out my next public tutorial on  “How to pick Singapore REIT for Dividend Investing” .

Continue ReadingSingapore REIT Fundamental Analysis Comparison Table – 8 Feb 2014

SATS: Watch the Crucial Support

  • Post author:

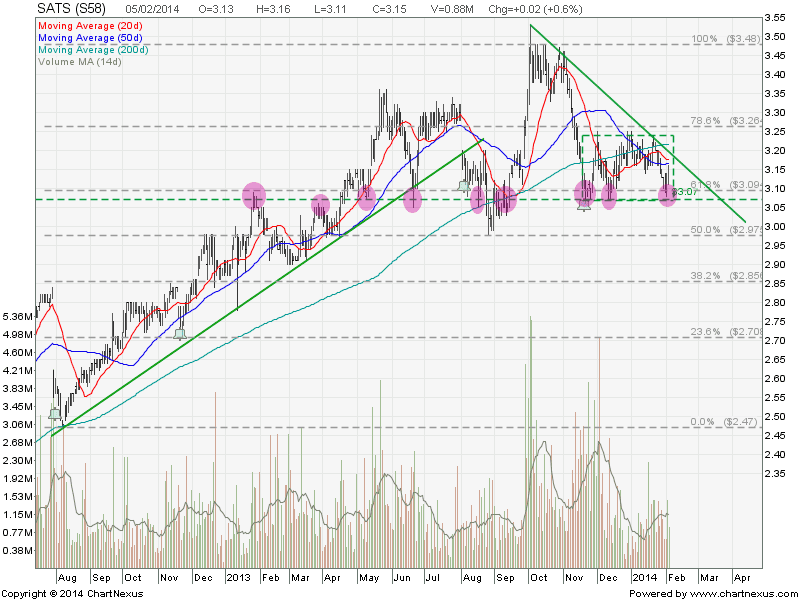
SATS  is holding well during the January 2014 worldwide sell off. The key question is: How Long can SATS continue to hold and avoid being sold off?

Base on the chart, SATS is currently trading in a Rectangle and also the Descending Triangle with a crucial resistance turned support zone between $3.07 and $3.10. This support zone coincides with the 61.8% Fibonacci Retracement Level. Upside is very limited as there are many resistances (20D, 50D, 200D SMA), Rectangles resistance and the Descending Triangle resistance from $3.16 to $3.24.

2014Feb5-SATS-800x600

Original post by Marubozu from My Stocks Investing Journey.

Fundamental Data for SATS

Current P/E Ratio (ttm) 18.7500
Estimated P/E(03/2014) 16.7553
Relative P/E vs. FSSTI 1.4917
Earnings Per Share (SGD) (ttm) 0.1680
Est. EPS (SGD) (03/2014) 0.1880
Est. PEG Ratio 1.7656
Market Cap (M SGD) 3,532.90
Shares Outstanding (M) 1,121.56
30 Day Average Volume 916,733
Price/Book (mrq) 2.5450
Price/Sale (ttm) 1.9475
Dividend Indicated Gross Yield 3.49%
Cash Dividend (SGD) 0.0500
Dividend Ex-Date 11/19/2013
5 Year Dividend Growth 1.39%
Next Earnings Announcement 02/11/2014

..

VALUATION RATIOS

Company Industry Sector
P/E Ratio (TTM) 17.31 19.48 1,065.88
P/E High – Last 5 Yrs. 16.87 104.42 43.28
P/E Low – Last 5 Yrs. 8.90 30.42 10.59


Summary

Fundamentally SATS is not cheap base on PE Ratio as current PE (TTM) is at the high end of PE High for the last 5 years. Dividend yield at 3.49% is not very attractive as there are other blue chip stocks or REIT with more attractive dividend yield.

Technically SATS upside is capped by the down trend line and there is a danger of breaking the crucial support. It is expected more selling to come if the support is broken. Good candidate to short with price target of $2.90 (Rectangle) and $2.70 (Descending Triangle).

Continue ReadingSATS: Watch the Crucial Support

Why Most Investors Lose Money in Real Estate and Property Stocks in 2013?

  • Post author:

In general, your portfolio should have a lot of red (if you are still holding now) if you have invested in any property stocks (Capitaland, Keppel Land, City Development, UOL, etc) and REITs but did not hedge your portfolio with CFD.

So A-million dollar questions to most of the investors or traders in Singapore including myself:

  1. Is it the right time to pick up property stocks or REITs since the stock price has dropped so much?
  2. What should I do if I am still holding those property stocks and REITs? Should I cut loss or hold on and wait for the recovery?
  3. Is there any trading opportunity in property stocks?

Fundamentally the real estate / property sectors are hit by all the cooling measures and fear of interest hike due to QE tapering. I will not touch on the above 2 topics as there are already a lot of news and articles talking the impact to the property sectors in Singapore. I will be focusing in using technical analysis to analyse the overall trend for property sectors as a whole and individual stocks.

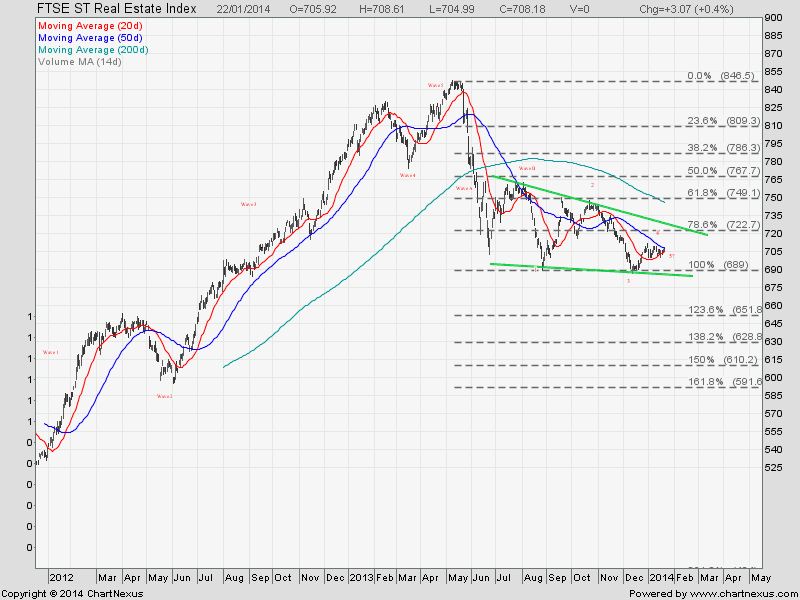
FTSE ST Real Estate Index

The index is trading in a Elliott Wave pattern and there is a possibility to start a Big Wave C down if break down from the Falling Wedge.

FTSE ST Real Estate Index Jan23-2014

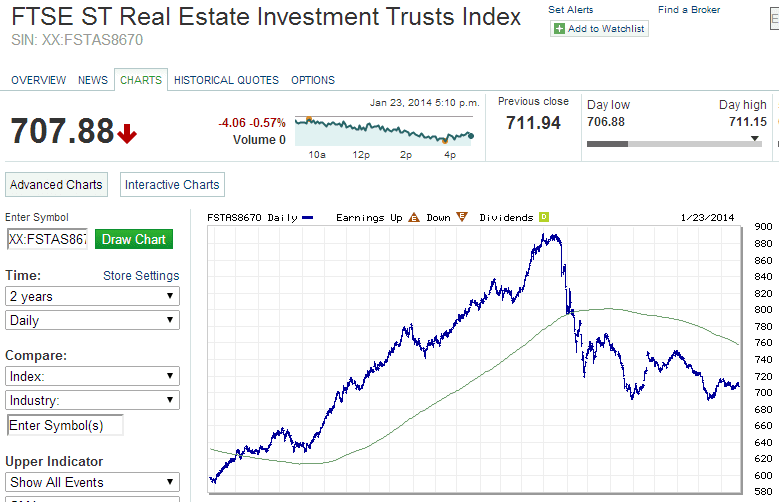
FTSE ST Real Estate Investment Trust Index

Singapore REITs is officially enter into bear trend after dropping more than 20% from the top.

The chart pattern is similar to FTSE ST Real Estate Index (Elliott Wave + Falling Wedge). More selling of the REIT is the support (about 690) of Falling wedge is broken.

FTSE ST Real Estate Investment Trust Index Jan23-2014

FTSE ST Real Estate Index Components Stocks

FTSE ST Real Estate Top 10 Companies Dec-2013

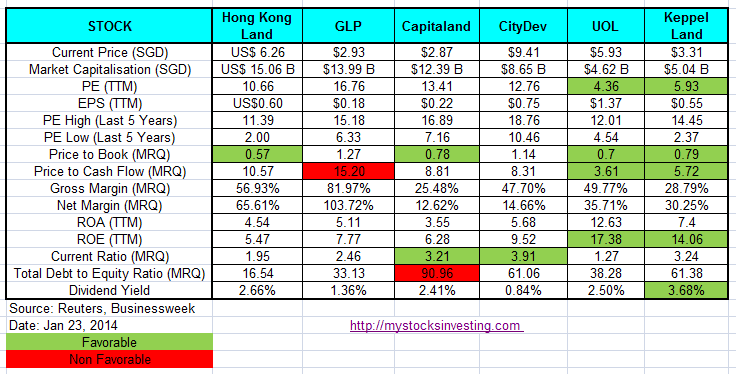
Fundamental Comparison for Key Component Stocks and Property Stocks

Property Stocks Fundamental Comparison Jan23-2014

Fundamental Comparison for Singapore REITs

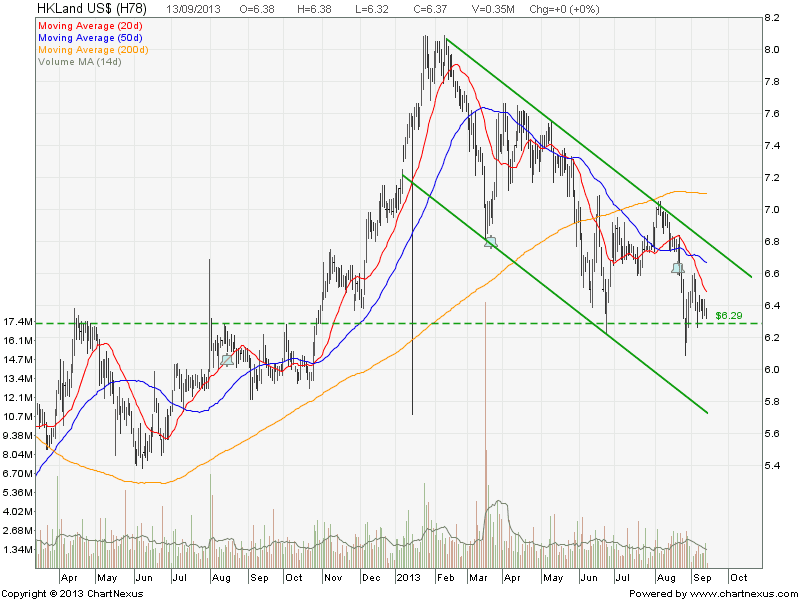
Hong Kong Land – Down Trend

HK Land Sept14-2013

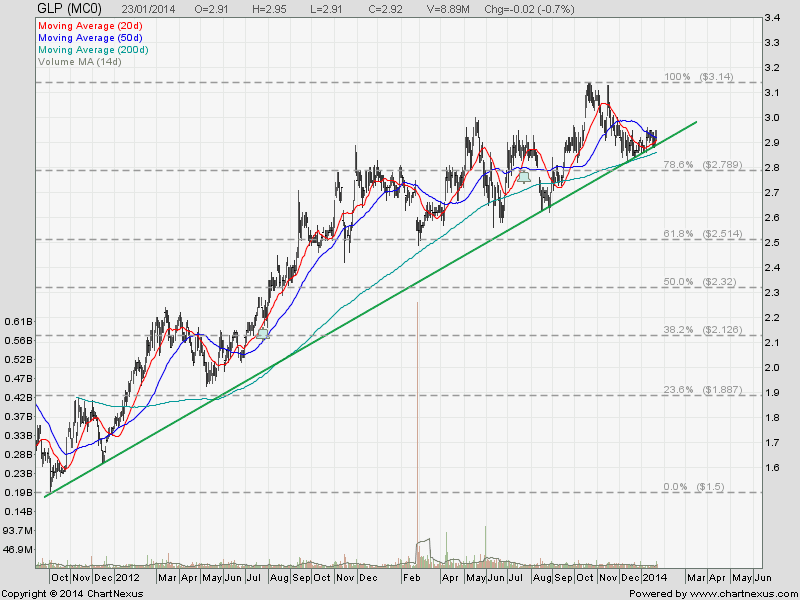
Global Logistic Properties (GLP) – Up Trend

2014Jan23-GLOBAL LOGISTIC PROP LIMITED-800x600

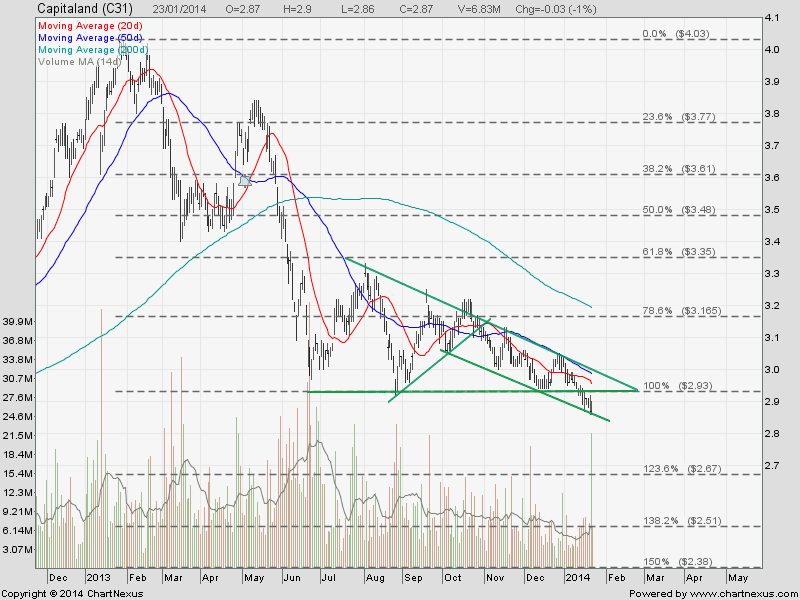
Capitaland – Break out from Descending Triangle. Continue Down Trend.

2014Jan23-Capitaland-800x600

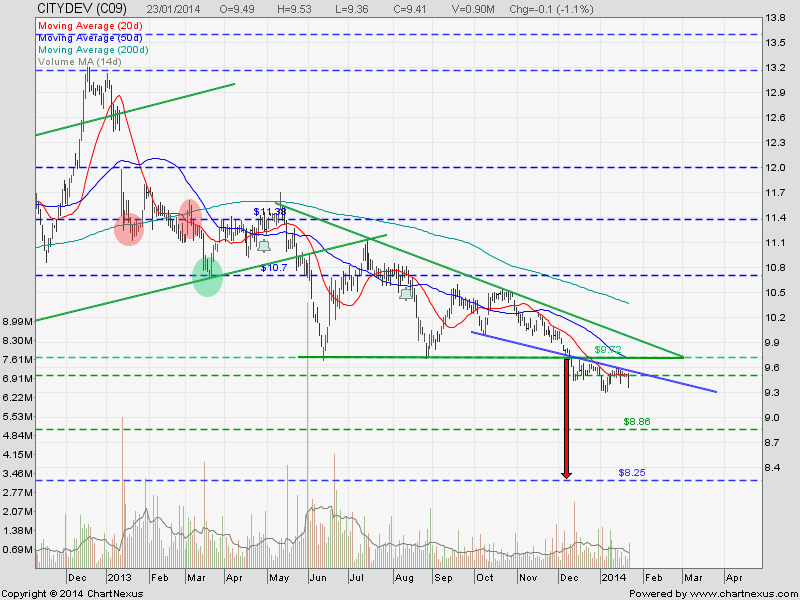
City Development – Break out from Descending Triangle. Continue Down Trend.

2014Jan23-CITYDEV-800x600

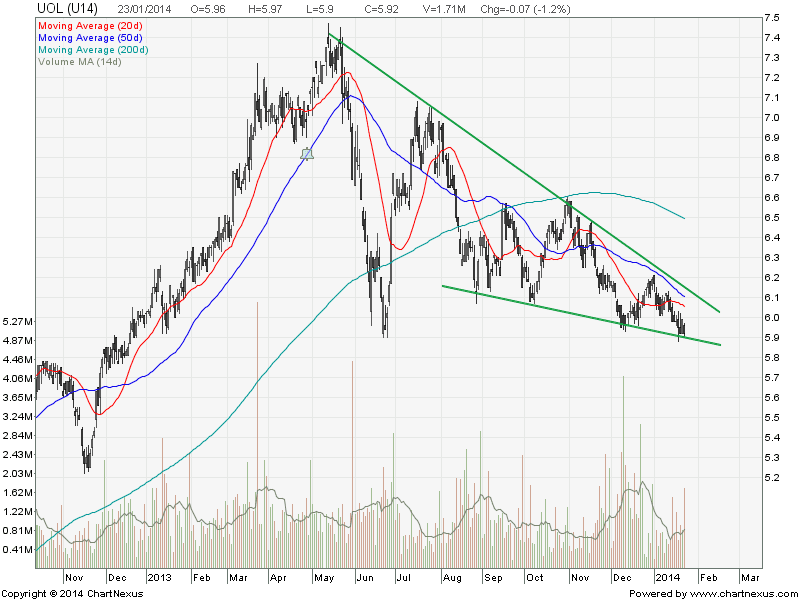
UOL Limited – Trading in a Falling Wedge.

UOL Jan23-2014

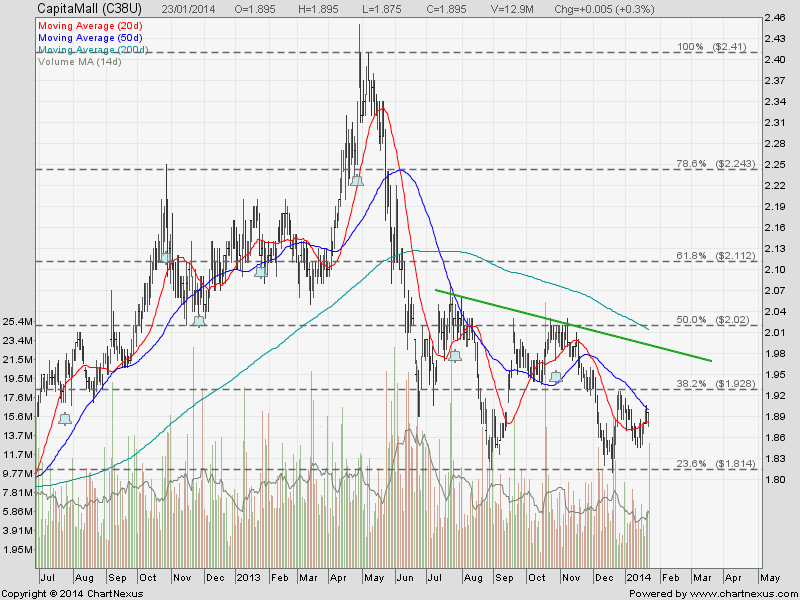
CapitaMall Trust – In consolidation.

2014Jan23-CapitaMall-800x600

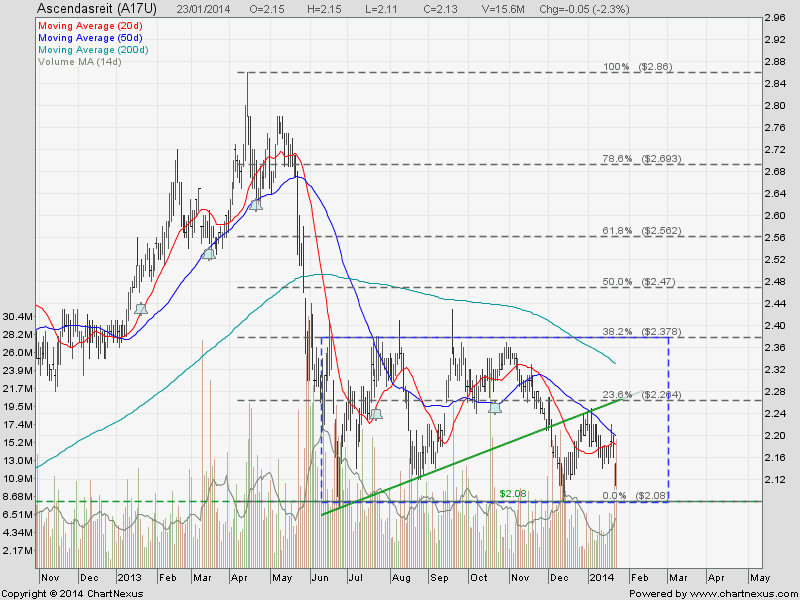
Ascendas REIT – Consolidation in Rectangle. Range Bound.

2014Jan23-Ascendasreit-800x600

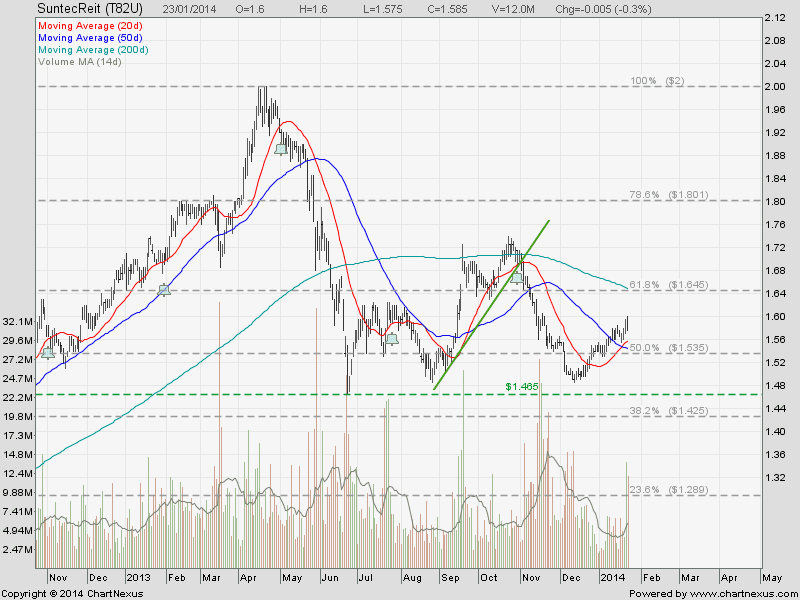
Suntec REIT – In consolidation.

2014Jan23 SuntecReit-800x600

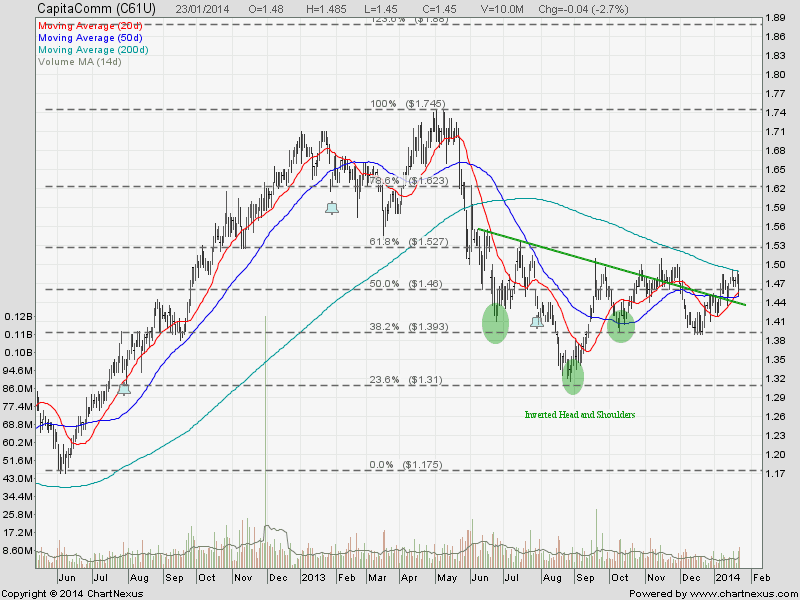
CapitaCommercial Trust – In consolidation.

2014Jan23-CapitaComm-800x600

Summary

Most of the property stocks and REITs either trading on down trend on in consolidation. Take note that the stocks are trading below 200D SMA (long term trend) which is sloping down (bearish signal). Base on the charts, this property and Real Estate sector have not found the bottom yet and probably will continue trading in a down trend in 2014. Bad news for investors who are still holding the stocks but good news for traders who know how to short the stock market. It will be a while for those smart investors who want undervalue stocks (Hong Kong Land, Capitaland, UOL, Keppel Land) to buy at bottom but need to keep a close eye on the chart.

Continue ReadingWhy Most Investors Lose Money in Real Estate and Property Stocks in 2013?