Will Shipping Stocks in 2014 Recover?
2014 is Wooden Horse Year. Base on Fengshui and Numerology, stocks associate with water and transportation (Horse is used as transportation in the old days) should do well in 2014. This trigger me to do an analysis on the Maritime sector and shipping stocks in Singapore.
Original post by Marubozu from My Stocks Investing Journey.
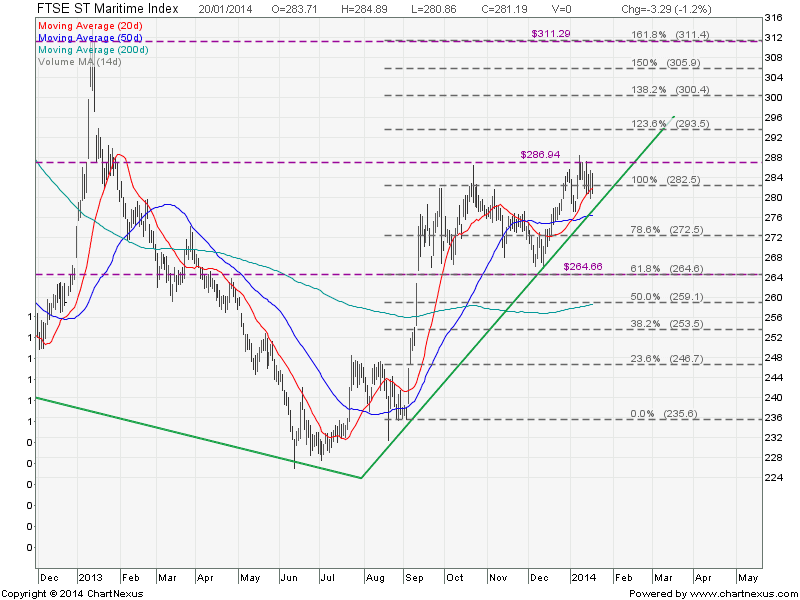
FTSE ST Maritime Index Chart
The index has started an uptrend (forming a Higher High and Higher Low) but need to see whether all the key component stocks are on up trend. If all big cap component stocks are showing the same up trend pattern, it means the shipping sector has recovered in 2014 as investors are back in this sector.
FTSE ST Maritime Index Components Stocks
Yangzijiang has the largest weightage (48.31%) in this index, followed by NOL, Cosco Corp, Jaya Holding and the rest.
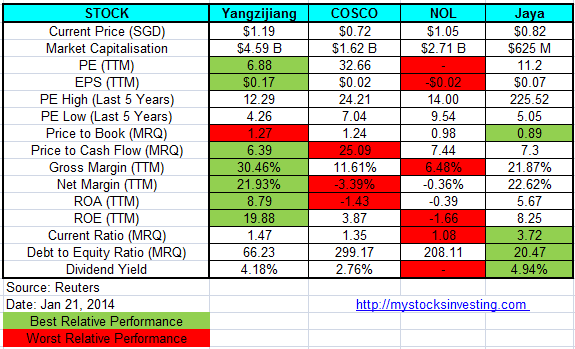
Fundamental Comparison for Key Component Stocks
In general, Yangzijiang has the best fundamental compare with other stocks in this Maritime Index, followed by Jaya Holding. Cosco & NOL fundamental are pretty weak at the moment. We need to monitor Cosco & NOL in the coming earning announcement to see whether there are any significant improvement in the financial.
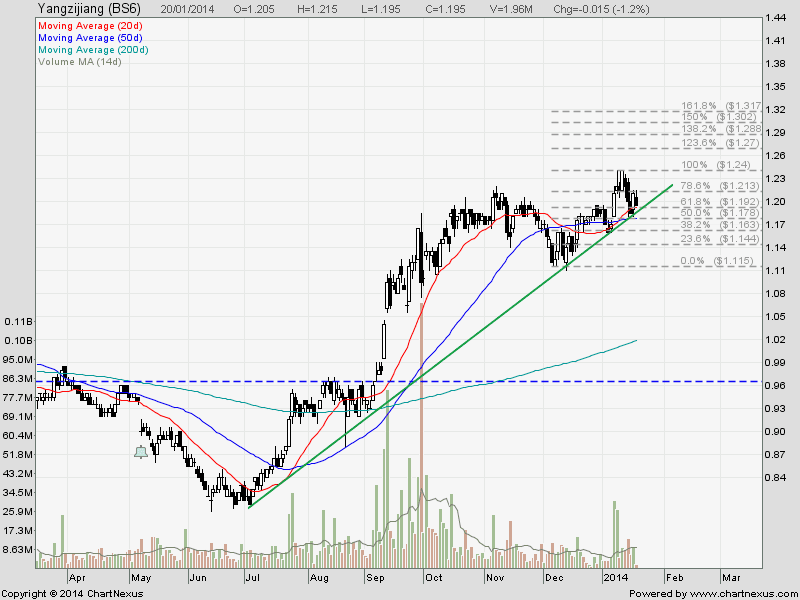
Yangzijiang Chart
YZJ is on uptrend and currently testing the uptrend support. This is the main reason that the FTSE ST Maritime Index is on up trend as YZJ has the largest weightage on the index. This is a FALSE alarm that Maritime or Shipping Industry has recovered.
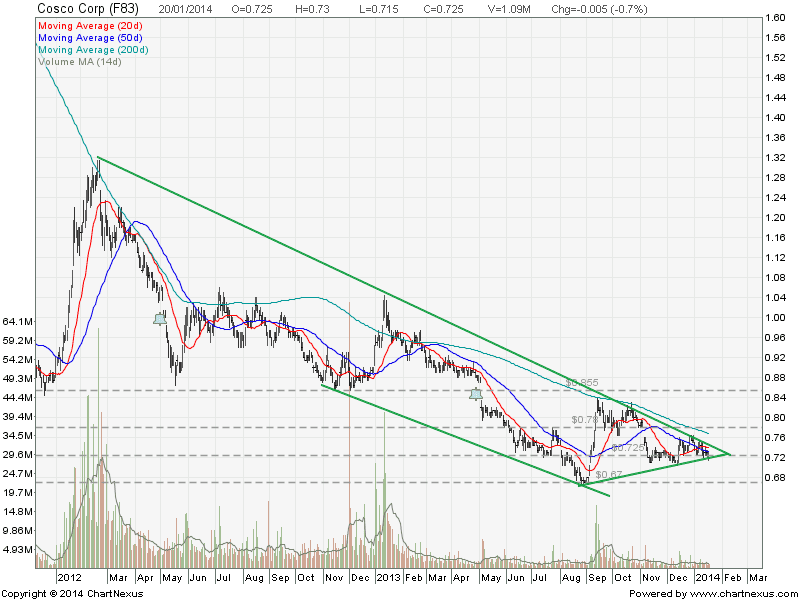
COSCO Chart
Cosco is currrently forming a Symmetrial Triangle and looks like has bottoming up. Watch out for the breakout and move above the 200D SMA resistance. This is the reversal pattern.
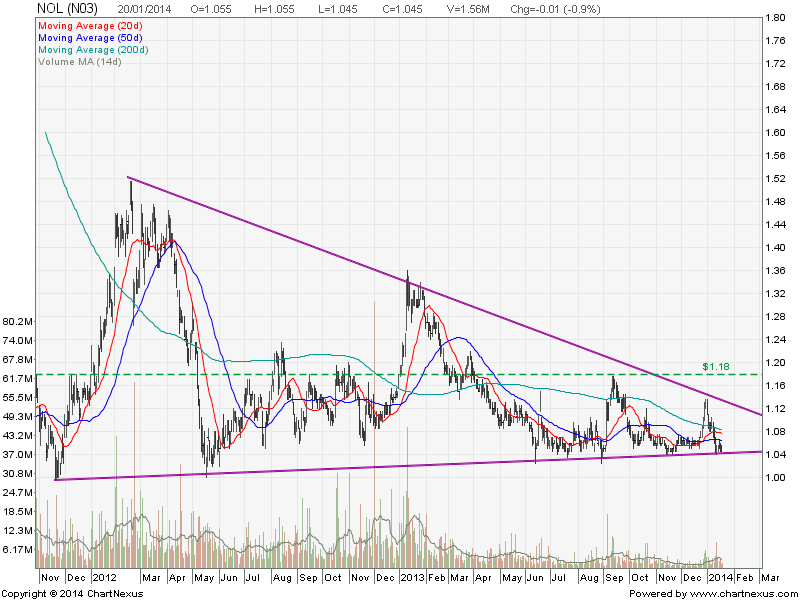
NOL Chart
NOL is consolidating in a big Descending Triangle and looks like finding a bottom at about $1.00. Watch out for the breakout to upside for trend reversal.
Jaya Holding Chart
Jaya Holding chart is bullish. The stock may move higher if the whole industry recovers due to Jaya’s good fundamental and the valuation is not demanding.
In Summary
There is a chance that Shipping stocks will recover in 2014.
Things to watch out for:
- Fundamentally Cosco & NOL must show improvement in their financial performance for subsequent 2 quarters.
- Technically Cosco & NOL must breakout and move above the 200D SMA resistance.
- As long as there are no shock news in terms of financial performance for Yangzijiang, Cosco & NOL, shipping stocks should recover and start an uptrend in 2014.

