SPDR Gold (GLD): Break DescendingTriangle Support!

  • Post author:

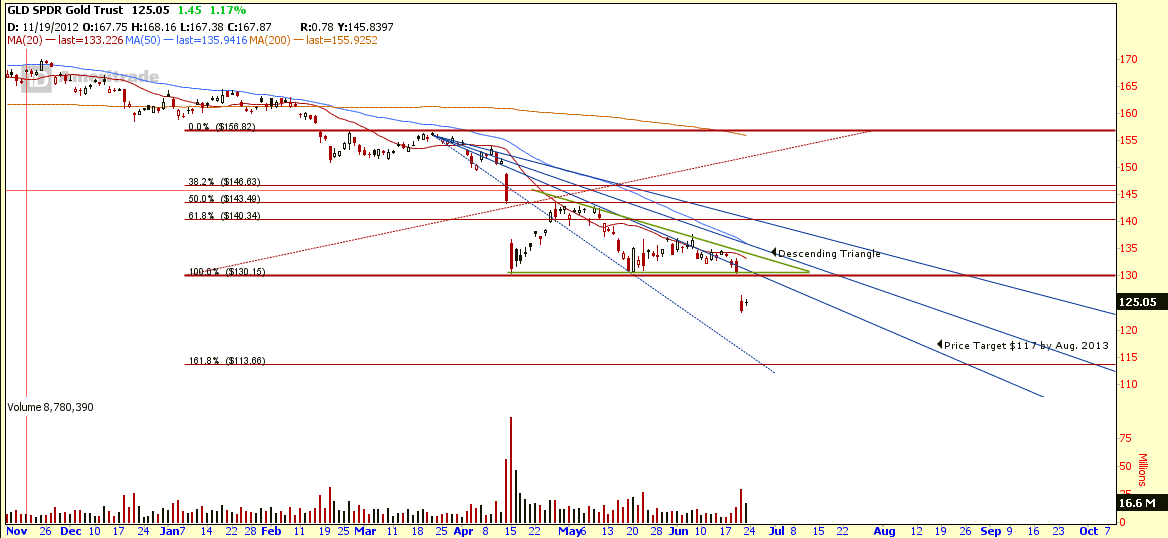
Expect another round of selling of GLD after this Gold ETF broke the $130 support. Price target for this Descending Triangle breakdown is minimum $117. With the help of Fibonacci Fan, GLD may reach this target by Aug 14, 2013.

GLD June22-2013

Current trade setup to short GLD using Vertical Spread.

  • Strategy: Long Vertical Put Spread
  • STO GLD Aug13 120 Put
  • BTO GLD Aug13 125 Put
  • Breakeven @ Expiry date on Aug16, 2013 = $123.22
  • Maximum Profit = $323
  • Maximum Loss = $177
  • Reward / Risk = 1.82
  • Cut Loss = GLD goes above $130

Previous Analysis on SPDR GOLD ETF (GLD).


Continue ReadingSPDR Gold (GLD): Break DescendingTriangle Support!

Noble Group: Is it Time to Buy?

  • Post author:

Noble Group current price is at 3 years low. Is it a good time to buy? Currently Noble Group is forming a big Descending Triangle and finding the support at the range between $1.00 to $1.05. There are tons of resistances (20D/50D/200D SMA and Triangle resistance) above the current stock price. Current chart setup is good for shorting but not good for longing. Breaking this critical support will send Noble Group to $0.70 range. Sit tight if you are holding this stock. Definitely not good for weak heart!

2013June1-Noble Group

Key Statistics for NOBL

Current P/E Ratio (ttm) 14.4303
Estimated P/E(12/2013) 9.9076
Relative P/E vs. FSSTI 1.0655
Earnings Per Share (USD) (ttm) 0.0570
Est. EPS (USD) (12/2013) 0.0830
Est. PEG Ratio 0.6904
Market Cap (M SGD) 6,862.75
Shares Outstanding (M) 6,598.80
30 Day Average Volume 27,338,330
Price/Book (mrq) 1.0157
Price/Sale (ttm) 0.0563
Dividend Indicated Gross Yield 2.16%
Cash Dividend (USD) 0.0181
Last Dividend 05/14/2013
5 Year Dividend Growth 0.53%
Next Earnings Announcement 08/07/2013
Continue ReadingNoble Group: Is it Time to Buy?

Starbucks SBUX: Standby to short!

  • Post author:

SBUX broke the down trend resistance & $50 psychological resistance. Currently SBUX is testing the previous support of Descending Triangle of $51.32. If SBUX turns down from this resistance, it is a good opportunity to short SBUX. (2/5 EMA crossover rule must apply!)


Key Statistics for SBUX

Current P/E Ratio (ttm) 28.8644
Estimated P/E (09/2012 ) 28.7556
Earnings Per Share (USD) (ttm) 1.7700
Est. EPS (USD) (09/2012) 1.7760
Est. PEG Ratio 1.5905
Market Cap (M USD) 38,828.40
Shares Outstanding (M) 760.00
Enterprise Value (M USD) (ttm) 36,883.40
Enterprise Value/EBITDA (ttm) 16.32
Price/Book (mrq) 7.2086
Price/Sale (ttm) 2.9829
Dividend Indicated Gross Yield 1.33%
Next Earnings Announcement 11/02/2012

Previous post on SBUX.


Continue ReadingStarbucks SBUX: Standby to short!