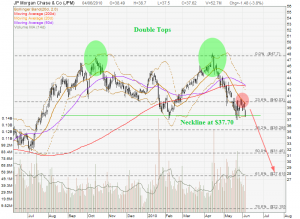
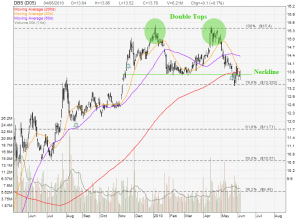
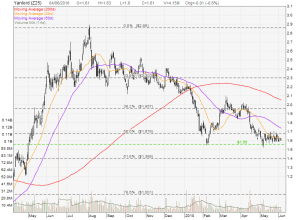
JPM is forming at Double Tops and currently just sitting on the neckline at $37.70. Base on the chart, there is a very high chance for a breakout of this Double Tops chart pattern due to the following observation:
- JPM is unable to break the 20D MA resistance (shaded in red) and bounces down.
- 50D MA is crossing down 200D MA.
- Stock price is hooking on the lower Bollinger Band
- MACD is going to show Bearish Convergence
- Parabolic SAR is going to reverse.
- RSI and Stochastic are reversing and turning down.

Plus fundemantally, all the negative news in Euro zone debt crisis and no clear signs that the crisis can be resolved in near term. Besides the PIIGS, now Hungary is coming into picture! I feel this crisis is even worse than than US financial crisis because Euro zone cannot print money to save those countries.
The breakout target price is $27.70 which is close to the 61.8% Fibonacci Retracement Level. I find no reason not to short JPM by buying a PUT option base on the current analysis. In addition, the implied volatility (IV) is low that make the option not so expensive. Any contrarion out that have a bullish view?


